
Schedly resources
Analytics for Scheduling Leaders: Data-Driven Decisions for Managers

Most scheduling leaders rely on gut feeling instead of data. This costs them thousands in wasted labor hours and missed revenue opportunities.
At Schedly, we've seen firsthand how analytics for scheduling leaders transforms operations. The managers who track booking rates, employee utilization, and no-show patterns make smarter decisions and run leaner teams.
The Three Metrics That Actually Matter for Your Scheduling Operations
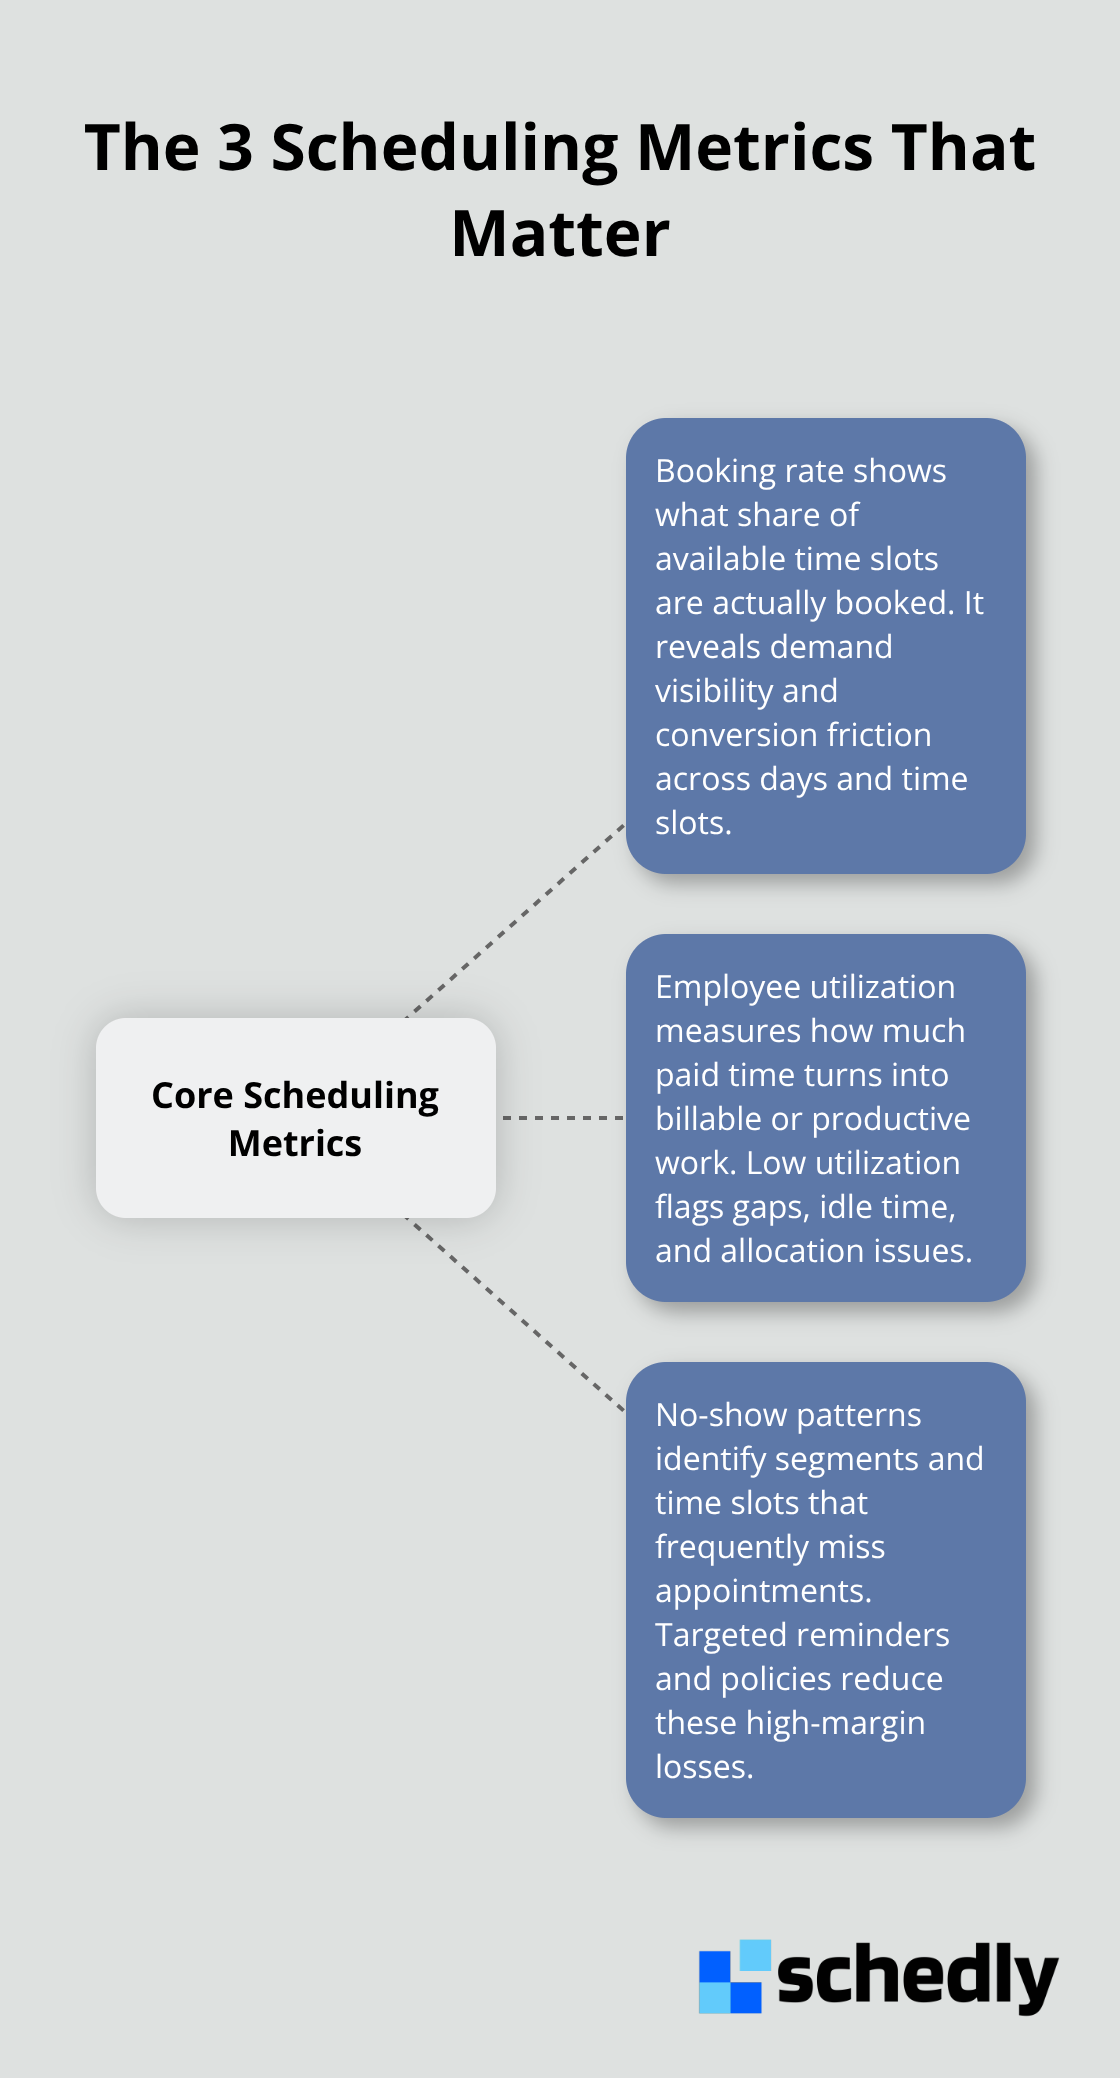
Tracking metrics without purpose wastes your time. We recommend focusing on three core metrics that directly impact your bottom line: booking rate, employee utilization, and no-show patterns. Your booking rate tells you what percentage of available time slots actually get booked. If your booking rate sits at 45%, you're leaving significant revenue on the table. Employee utilization reveals how much of your team's paid time translates into billable or productive work.
Booking Rate Reveals Your Real Demand Problem
Most scheduling leaders assume low booking rates mean weak demand. That's wrong. A low booking rate typically exposes poor scheduling visibility or friction in your booking process. If customers can't see availability clearly or the booking system takes more than three clicks, your rate suffers. Start by measuring your current booking rate across each day of the week and each time slot. You'll likely find specific hours or days perform much better than others. This data should inform your staffing decisions immediately. If Tuesday mornings show a 65% booking rate while Wednesday afternoons show 35%, staff accordingly rather than spreading resources evenly. Conversion metrics matter equally-track how many customers who start the booking process actually complete it. A 40% abandonment rate during payment processing indicates a friction point worth fixing before anything else.
Employee Utilization Exposes Hidden Labor Costs
Employee utilization directly impacts your labor costs. If you employ someone for 40 hours weekly but only schedule 28 billable hours, you're absorbing 12 hours of unproductive time. Track this ruthlessly. Separate scheduled time from actual productive time to see where gaps emerge. Unexpected absences, gaps between appointments, and administrative tasks all contribute to low utilization. Once you see the pattern, you can adjust scheduling to cluster appointments, reduce gaps, or reassign staff during slow periods. This approach transforms how you allocate resources across your operation.
No-Show Patterns Drive Your Highest-Margin Losses
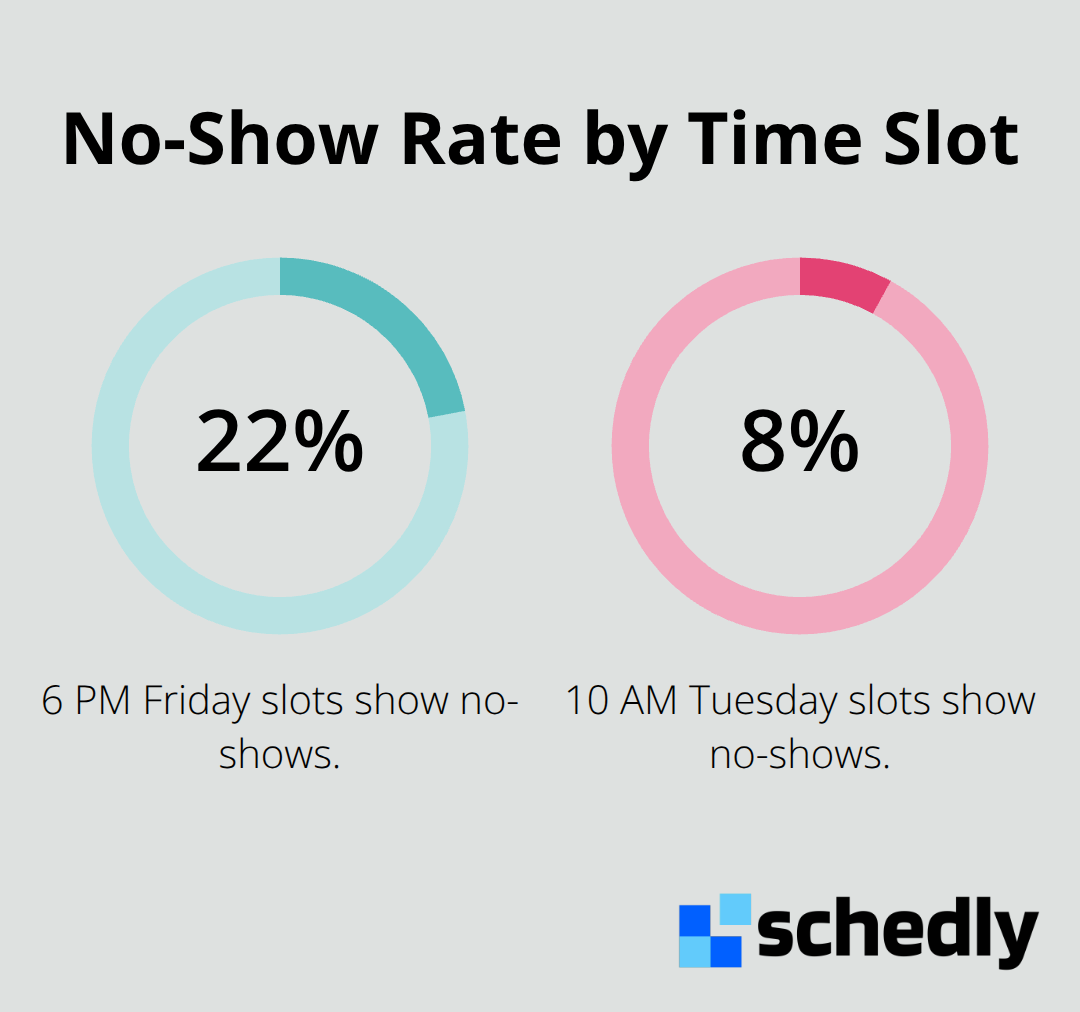
No-show patterns deserve equal attention because they're your highest-margin revenue loss. A customer who books but doesn't show costs you both the revenue and the paid labor you allocated. Implement a no-show rate metric by customer segment and time slot. If your 6 PM Friday slots show a 22% no-show rate while your 10 AM Tuesday slots show 8%, your scheduling strategy should reflect this reality.
Turning Data Into Your Scheduling Blueprint
The metrics you now track reveal problems, but they don't solve them. Your booking rate shows demand gaps, your utilization rate exposes labor waste, and your no-show patterns highlight revenue leaks. Converting this information into action requires a structured approach to forecasting, resource allocation, and performance management.
Build Your Demand Forecast From Historical Patterns
Start with your booking and no-show data to construct a demand forecast by day and time slot. If your Tuesday 10 AM slots consistently book at 75% while Wednesday 2 PM slots sit at 35%, project forward three months using this pattern. Account for seasonal fluctuations-healthcare practices see higher demand in January for preventative care, while salons experience peaks around holidays and special events. Once you have this forecast, staff inversely to your no-show rates. If your 6 PM Friday slots show 22% no-shows, schedule 28% more capacity to compensate for expected cancellations. This prevents the costly scenario of turning away customers while simultaneously paying staff who sit idle.
Tools that integrate time tracking with scheduling data make this automatic-they flag when actual demand deviates from your forecast so you can adjust staffing in real time rather than waiting for monthly reports.
Match Staffing to Actual Demand Patterns
Most teams staff by tradition rather than data. They schedule the same people on the same shifts week after week because that's how it's always been done. This approach ignores what your metrics reveal. If your utilization data shows that certain staff members complete tasks 30% faster than others, concentrate appointments with high-demand customers toward your fastest performers during peak hours. Reserve your slower periods for training, administrative work, or lower-priority tasks. This simple reallocation typically increases utilization by 8 to 12 percentage points.
Idle time between appointments represents pure waste-a 15-minute gap between back-to-back services costs you both revenue and wages. Cluster appointments tightly (scheduling similar service types consecutively reduces setup time and travel time for service-based businesses). Your data should also reveal which staff members handle specific customer segments most effectively. If one team member converts 65% of consultations while another converts 42%, assign your most difficult prospects to the higher performer during peak demand windows. Performance tracking data from your scheduling system shows exactly how long each task takes for each person, enabling precise scheduling that maximizes output without burning people out.
Prevent Burnout While Maximizing Output
Workload balance metrics separate good scheduling from great scheduling. Track not just hours worked but also the intensity and variety of work assigned. A team member scheduled for eight hours of back-to-back high-intensity tasks faces burnout risk, while the same person scheduled for six hours with mixed task difficulty performs sustainably. Industry research found that employees working at 80 to 90 percent capacity show the highest productivity.
Your scheduling software should flag when individual team members exceed this threshold, prompting you to redistribute work before problems emerge. Monitor break patterns and idle time separately from productive time-if someone works four hours straight without a break, their performance on task five drops measurably. Stagger breaks strategically around your peak demand periods rather than assigning them uniformly. This maintains service availability while protecting employee wellbeing. Use your no-show data to identify which time slots and customer types create the most stress on your team, then rotate these assignments so no single person absorbs disproportionate difficulty.
The data you've collected now points toward specific operational improvements. The next step involves measuring whether these changes actually work-and adjusting your approach based on what the numbers tell you.
Where Analytics Drive Real Scheduling Wins
Your data now reveals exactly where your operation bleeds money and where customers disappear. The scheduling leaders who act on this information see measurable improvements in three critical areas: customer retention, operational efficiency, and the ability to scale without proportional cost increases.
Real Results From Data-Driven Scheduling Changes
A healthcare practice tracked no-show patterns and discovered that 34% of cancellations came from a specific time slot on Friday afternoons. They implemented a two-hour earlier reminder and added a small cancellation fee for that slot. Within six weeks, no-shows dropped from 22% to 9% in that window, recovering approximately 13 additional billable hours per month-roughly $1,560 in recovered revenue annually from one scheduling adjustment.
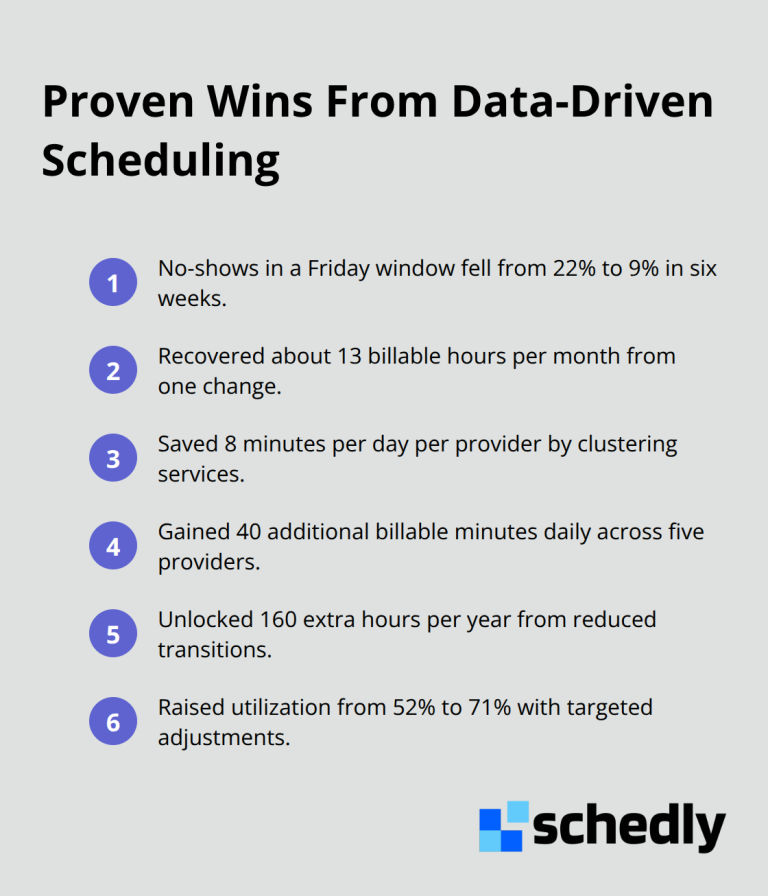
The same practice used utilization data to cluster similar appointment types, reducing administrative time between services by an average of 8 minutes per day. Across their team of five providers, this translated to 40 additional billable minutes daily or 160 hours per year. Customer satisfaction scores improved simultaneously because providers spent less time on transitions and more time on actual service delivery.
Scaling Across Locations With Location-Specific Data
Scaling across multiple locations requires abandoning the assumption that what works in one location works everywhere. A salon with three locations discovered that their flagship location maintained 78% utilization while their second location operated at 52%. Rather than applying the same staffing model uniformly, they analyzed demand patterns location by location.
The underperforming location had peak demand at different hours than the flagship, and their stylists took longer on average for each service. They reassigned one high-performer to that location during peak hours, adjusted pricing to reflect actual service duration, and implemented tighter appointment clustering based on local demand data. Within two months, utilization climbed to 71%.
A multi-location fitness business that previously staffed all locations identically found that weekend morning classes packed to 95% capacity while weekday evening classes averaged 35% occupancy. They shifted instructors to match actual demand, reduced instructor hours at underperforming times, and increased class variety during peak windows. This prevented the costly mistake of hiring staff uniformly when demand distribution didn't justify it.
Matching Marketing Spend to Customer Behavior
Your booking rate and no-show metrics reveal which customer segments generate the most stable revenue. A consulting firm noticed that clients booked through referrals showed 8% no-show rates while those from paid advertising showed 24% no-shows. They adjusted their marketing spend allocation and implemented stricter confirmation protocols for paid-traffic bookings. Revenue stability improved because their forecasting became more accurate.
Optimizing Labor Cost Per Appointment
The operational cost reduction comes not from cutting staff indiscriminately but from deploying existing staff where data proves they generate the most value. Track labor cost per appointment completed, not just total hours worked. If location A generates $85 in labor cost per completed appointment while location B generates $120, your scheduling strategy should concentrate volume in location A until you address the efficiency gap in location B. These aren't theoretical improvements-they're direct results of matching scheduling decisions to what your data actually shows about customer behavior and team performance.
Final Thoughts
The three metrics you've learned to track-booking rate, employee utilization, and no-show patterns-form the foundation of smarter scheduling operations. Booking rate exposes demand visibility problems and conversion friction. Utilization reveals where labor dollars disappear into idle time. No-show patterns pinpoint your highest-margin revenue losses. Together, they eliminate guesswork from your scheduling decisions and replace it with facts about how your operation actually performs.
Implementing analytics for scheduling leaders requires a practical sequence: measure your current state across these three metrics for at least four weeks to establish baseline patterns, identify which metric shows the biggest opportunity for improvement, make one targeted change based on what your data reveals, then measure the impact over the following month. This prevents overwhelming your team with simultaneous changes while proving that data-driven decisions actually work. Only after confirming results should you move to the next optimization.
The scheduling leaders who see the fastest results use software that automates metric tracking rather than relying on manual spreadsheets. Schedly's analytics dashboard tracks booking patterns, customer behavior, and team performance in real time, eliminating the lag between data collection and decision-making. When your system flags that Wednesday afternoons show 35% booking rates while Tuesday mornings show 65%, you adjust staffing immediately rather than waiting for monthly reports.