
Schedly resources
Analytics for Scheduling Managers: From Data to Decisions
Most scheduling managers operate on instinct and habit rather than hard data. They react to problems after they happen instead of preventing them.
At Schedly, we've seen firsthand how analytics for scheduling managers transforms operations. When you measure the right metrics, you stop guessing and start making decisions that directly impact your bottom line.
Why You Need Analytics to Stop Losing Money on Bad Schedules
Most scheduling managers have no idea how much money walks out the door because of poor staffing decisions. Without analytics, you're flying blind. You can't see which time slots have the highest demand, which employees are actually productive, or where your operation is bleeding hours and revenue. The result is predictable: overstaffing during slow periods, understaffing during rushes, and employees sitting idle while customers wait. Analytics transforms scheduling from a reactive guessing game into a strategic operation where every decision rests on real data about your business.
Employee Utilization Reveals Hidden Labor Waste
Employee utilization measures the percentage of paid time that translates into billable work, and most businesses operate far below what's possible. The ideal utilization rate is usually 70 to 90% for production-level staff. If your team targets 70% utilization but you're running at 55%, you're throwing away thousands in labor costs every month. The gaps between appointments, idle time between tasks, and administrative overhead add up fast. When you track utilization by employee and time slot, you immediately spot who's productive and when your team wastes time. One scheduling manager adjusted staffing to reduce gaps between appointments and recovered nearly 13 billable hours per month in just one slot within six weeks. That's real money. The key is measuring labor cost per completed appointment, not total hours worked. This metric tells you exactly where to concentrate volume and which inefficiencies cost you the most.
No-Shows and Cancellations Destroy Your Revenue Plan
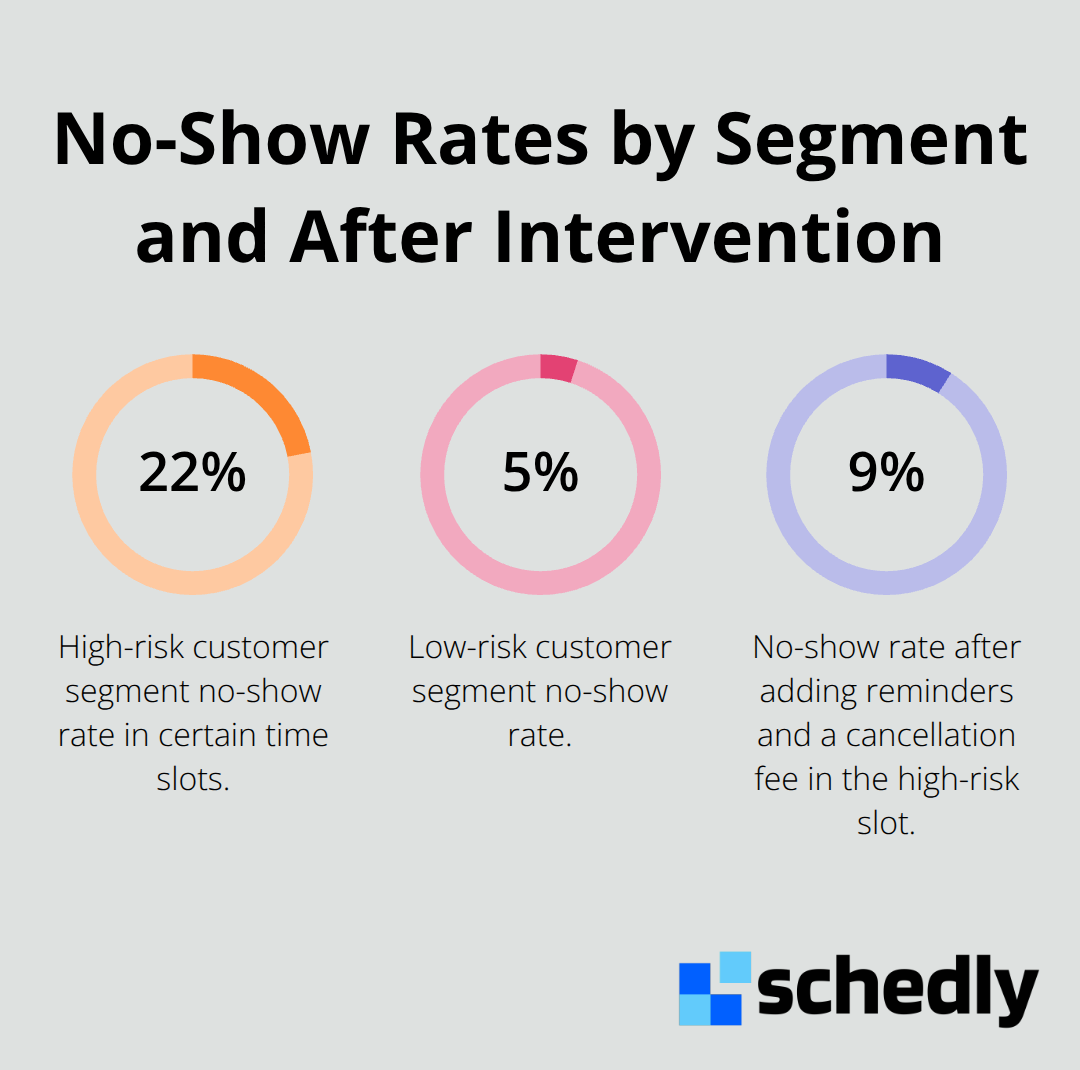
If you don't track no-show patterns, you're letting customers control your bottom line. No-shows vary dramatically by customer segment, time slot, and day of week. Some segments cancel 22% of the time while others hover at 5%. Without this data, you either overstaff to cover cancellations you can't predict or understaff and turn away paying customers. The fix is specific: segment your no-show data by customer type and time slot, then use appointment reminders to reduce cancellations.
Booking Rates Show You Where Demand Actually Exists
Your booking rate measures the percentage of available time slots customers actually book, and it's the foundation for smart staffing. If your booking rate is 65% on Tuesday mornings but only 35% on Wednesday afternoons, you're staffing wrong. You should reallocate people to Tuesday mornings and reduce Wednesday afternoon coverage to focus on higher-demand windows. Time analysis transforms booking strategy more than any other metric. High abandonment during payment means customers want to book but can't complete the transaction-fix that before making broader scheduling changes. Track booking rates by day of week, time slot, and customer segment. This granular view tells you exactly where to invest staff and where to cut slack. Seasonality matters too. Healthcare practices see January demand spikes while salons peak around holidays. When you forecast demand from historical patterns specific to your business, you adjust capacity ahead of time instead of scrambling last minute.
Forecasting Demand Prevents Staffing Chaos
Historical patterns reveal what your customers actually need at specific times. When you forecast demand from your own data (not industry averages), you adjust staffing before problems hit. A salon that knows it faces 40% higher demand in November can schedule extra staff weeks in advance instead of calling people in at the last minute. A healthcare practice that tracks January peaks can plan coverage without burning out the team. Forecasting also helps you avoid the trap of overstaffing slow periods. If Wednesday afternoons consistently show 35% booking rates, you don't need full coverage that day. You redirect those hours to Tuesday mornings where demand is real. This shift alone reduces labor waste and improves employee morale because people work during times when they're actually needed.
The metrics you've learned here form the foundation for smarter decisions. But raw numbers mean nothing without a system to act on them. The next chapter shows you how to translate these metrics into the specific staffing changes that move the needle.
The Three Metrics That Actually Move Your Bottom Line
Labor Cost Per Completed Appointment Reveals Your True Profitability
Labor cost per completed appointment is the metric most scheduling managers ignore, and that's exactly why they leave money on the table. You need to track how much you spend in wages to deliver each service, not just total hours worked. If appointment A costs you $45 in labor but you charge $80, your margin is healthy. If appointment B costs $65 in labor for the same price, you have a problem.
Calculate this by dividing total labor costs in a period by the number of completed appointments. When you break this down by employee and time slot, you see immediately where your operation bleeds money. An employee who handles three appointments per hour generates better margins than one who handles two, even if both work the same shift. This metric also reveals whether certain time slots are worth staffing at all. A Wednesday afternoon slot that generates only two appointments might cost more in wages than it brings in revenue. Once you see this clearly, you make smarter decisions about which hours to staff and which employees to assign to high-value windows.
Employee Utilization and Shift Coverage Work Together
Employee utilization and shift coverage prevent both understaffing and waste. Utilization tells you what percentage of paid time translates into billable work, and the target for most service businesses is 70 to 90 percent. Track this by measuring the gap between scheduled time and actual productive time-idle moments between appointments, absences, administrative tasks, and training all count as non-billable. If your team is scheduled for 40 hours but only 30 hours translate into billable appointments, you're running at 75 percent utilization.
Most managers don't track this metric at all, so they have no idea whether their team is productive or just sitting around waiting for customers. Shift coverage complements utilization by showing whether you have enough staff to meet demand without overloading individuals. Try for 80 to 90 percent capacity as optimal-this keeps people working without burning them out.
Customer Wait Times and Service Quality Indicators Show Your Real Performance
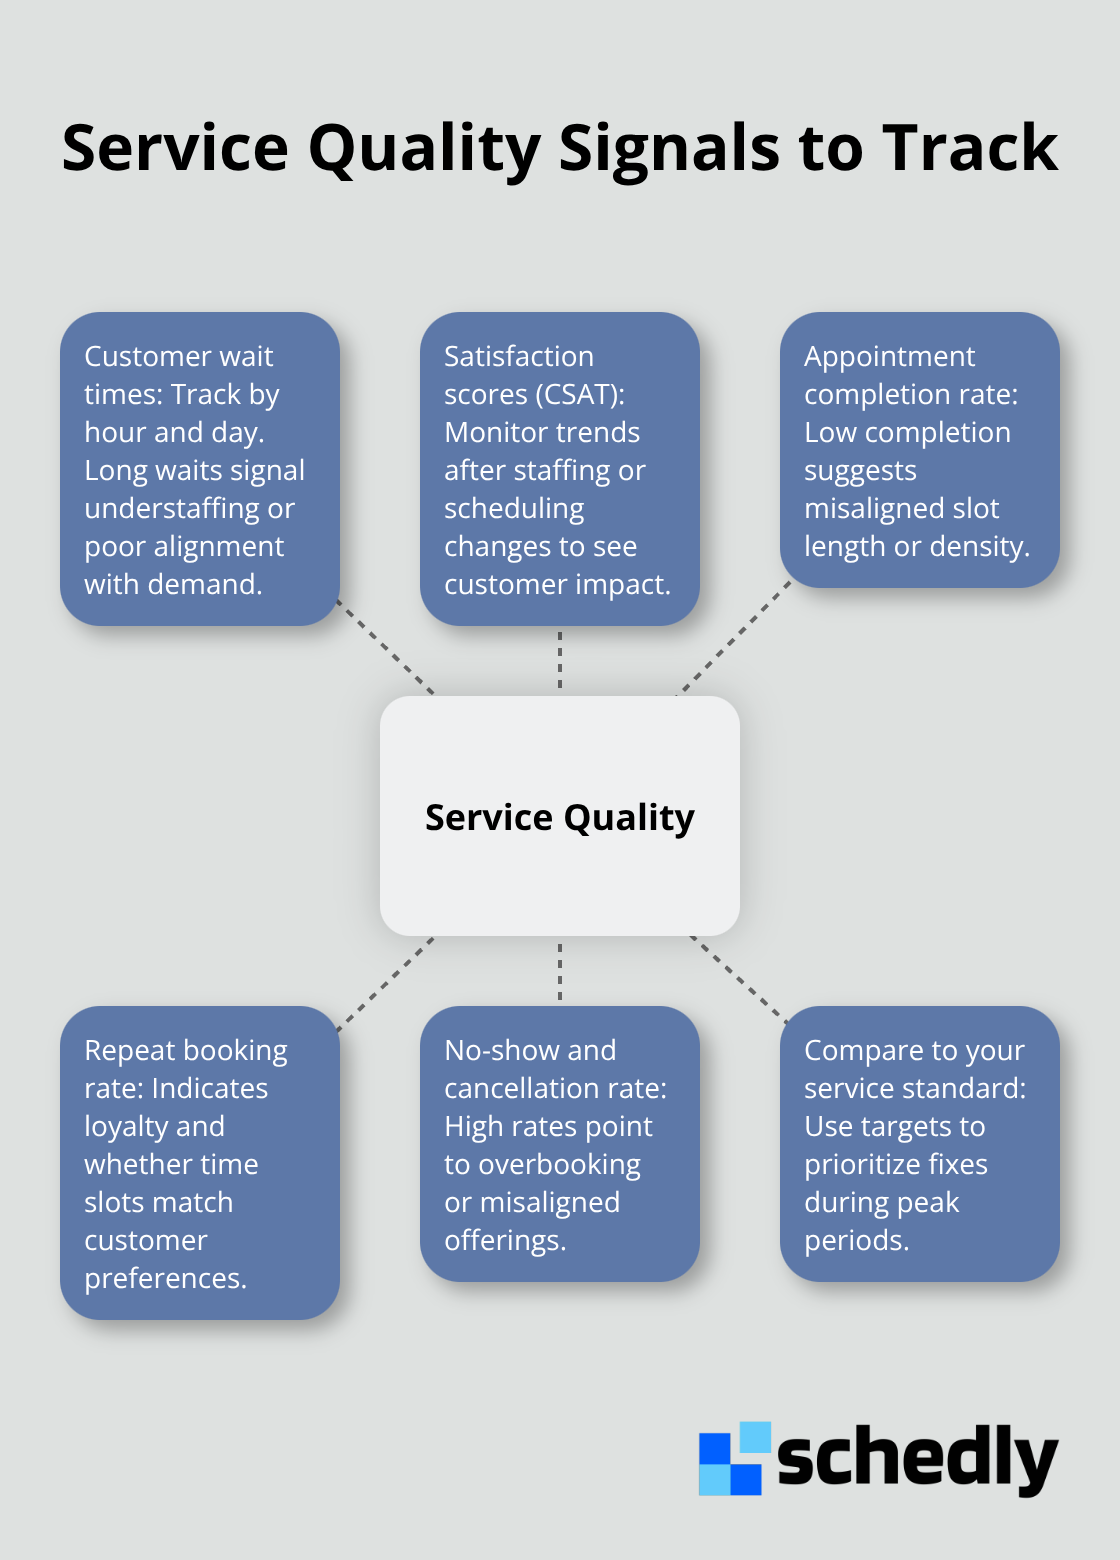
Customer wait times and service quality indicators measure whether your scheduling actually serves customers well. Long wait times indicate understaffing or poor scheduling alignment with demand. Track average wait time by hour of day and day of week, then compare it to your service standard. If customers wait 15 minutes on average but your standard is 5 minutes, you need to adjust staffing or reduce appointment density during peak periods.
Quality indicators include customer satisfaction scores, appointment completion rates, and repeat booking rates. A high no-show rate or cancellation rate signals that customers aren't committed to their appointments-this often means you're overbooked or offering time slots that don't match customer preferences. When you monitor these three metrics together (labor cost per appointment, utilization, and service quality), you see the complete picture: whether your team is productive, whether you're meeting customer demand, and whether you're generating profit on every shift.
The data you collect from these metrics only matters if you act on it. The next chapter shows you how to translate patterns in your numbers into specific staffing decisions that actually improve your operation.
From Pattern Recognition to Staffing Action
Raw data sits useless until you spot the patterns that drive revenue. The difference between a scheduling manager who wins and one who loses comes down to this: can you see what the numbers are actually telling you? Most managers collect data but never look at it hard enough to act. You need to develop a specific habit: look at your metrics the same way every week, spot what changed from last week, and decide what to do about it.
Booking Rates Show Where to Move Your Staff
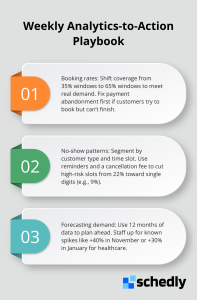
Start with your booking rates by day and time slot. If Tuesday mornings consistently show 65% booking while Wednesday afternoons sit at 35%, that gap is your roadmap. Move your strongest performers to Tuesday mornings where demand exists. Cut Wednesday afternoon staff to just enough to serve the few customers who book then. This single shift recovered nearly 13 billable hours per month for one operation in six weeks. The key is acting on the pattern, not just seeing it.
No-Show Patterns Reveal Your Revenue Risk
Next, examine your no-show patterns by customer segment and time slot. One scheduling manager found that customers who booked through paid advertising cancelled 22% of the time in certain slots, while organic customers cancelled only 5%. She added a 24-hour reminder and a cancellation fee for the high-risk segment, cutting no-shows to 9% within weeks. That decision came straight from the pattern in her data. She did not guess which customers were risky; the numbers showed her.
Forecasting Demand Prevents Last-Minute Scrambles
Pull your forecasting demand from 12 months of historical booking data and group it by week, day, and hour. You will see that November has 40% higher demand than September, or that Friday evenings book twice as fast as Tuesday afternoons. A healthcare practice that knows January demand spikes 30% can schedule extra coverage weeks ahead instead of burning out the team with emergency calls. A salon that sees holiday peaks can hire temporary staff or adjust hours strategically. This level of forecasting accuracy comes only from your own data, not industry averages.
Location-Specific Benchmarks Beat Industry Averages
Industry benchmarks mislead you because your business is unique. A salon in a downtown location might run 78% utilization while a suburban location runs 52% with identical staffing. After you saw that gap, you reallocated staff to the high-utilization location and adjusted pricing at the low-utilization location. Within months, both locations moved toward the same target. The real benchmark is your own performance over time.
Labor Cost Improvements Prove Your Changes Work
Track labor cost per completed appointment every month and watch how it changes as you adjust staffing. If it drops from $50 to $42 per appointment, you have made your operation 16% more profitable on the same revenue. That improvement came from seeing the pattern and acting on it. Most scheduling managers never measure this metric, so they have no idea whether their changes actually work. You must measure, compare, and adjust. This is how data becomes action.
Final Thoughts
Analytics for scheduling managers transforms your operation the moment you act on what the data reveals. The managers who win measure their metrics consistently, spot the patterns that drive profit, and adjust staffing accordingly. You no longer guess which time slots need coverage or which employees generate the best margins-your data tells you exactly what to do.
Start this week with one metric that matters most to your business: labor cost per completed appointment, employee utilization, or no-show patterns. Measure it consistently, see what changes from week to week, and make staffing decisions based on what you observe. When Tuesday mornings show 65% booking rates but Wednesday afternoons sit at 35%, you move your strongest performers to where demand exists. When your data shows one customer segment cancels twice as often as another, you add reminders or adjust pricing for that segment. These decisions are obvious once you see the pattern in your numbers.
At Schedly, we built analytics into our scheduling platform so managers like you can track these metrics without extra work and spot patterns in real time. Your next step is simple: measure one metric this week and act on what it tells you.