
Schedly resources
Data Driven Decisions: How Analytics Shape Strategy

Most companies still rely on gut feeling to shape their strategy. At Schedly, we've seen firsthand how data-driven decisions separate market leaders from the rest.
The difference is stark: organizations that measure what matters outperform those that guess. This blog post shows you exactly which metrics to track and how to build a team that acts on them.
Do Data-Driven Companies Actually Win
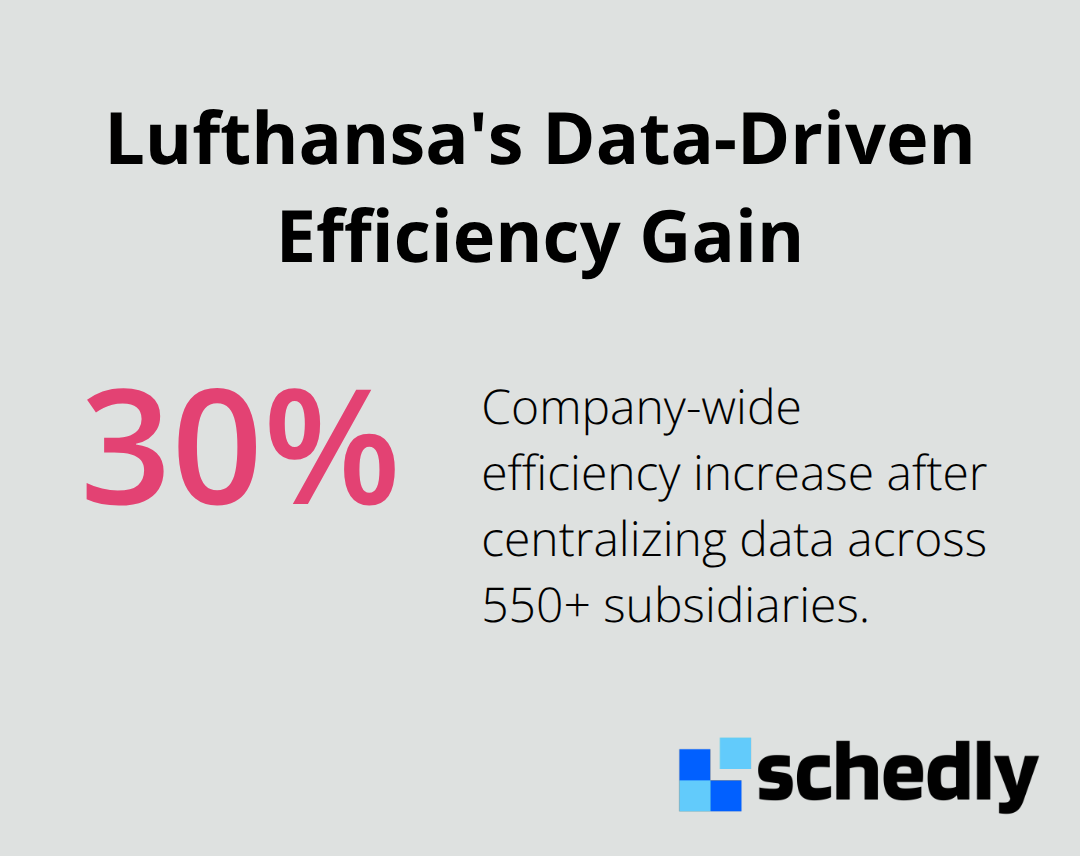
Companies that measure performance consistently beat their competitors. According to research from Forbes, organizations making data-driven decisions improve customer satisfaction, increase profits, and enhance problem-solving capabilities. The gap isn't small either. Lufthansa centralized its data practices across more than 550 subsidiaries and achieved a 30% increase in company-wide efficiency as a result. When you stop guessing and start measuring, the numbers speak for themselves.
Speed Matters More Than You Think
Real-time data changes everything about how fast you can respond to market shifts. A competitor launches a new feature, customer preferences shift overnight, or supply chain disruptions hit without warning. Companies relying on monthly reports or quarterly reviews move too slowly to capitalize on these moments. Nike demonstrates this perfectly-the company uses real-time data on demand, material availability, and distribution to optimize supply chains, reduce costs, and shorten delivery times. The businesses winning today aren't just making better decisions. They make them faster. When you have access to current information about what customers are doing, where your operations are lagging, and which strategies are actually working, you adjust course immediately instead of waiting for the next planning cycle. This speed advantage compounds over time, creating a widening gap between data-driven organizations and those still operating on assumptions.
Confidence Replaces Guesswork
Strategic decisions without data backing them feel risky because they are. According to Ohio University's research on data-driven decision-making, about half of American business professionals still rely on intuition even when contradicting data exists. That's a recipe for expensive mistakes. When you base decisions on actual metrics-customer behavior, revenue trends, operational performance-you remove the emotion and politics from the conversation. A product manager proposing a feature has hard numbers showing user demand. A marketing director allocating budget can point to campaign performance data. A finance team forecasting next quarter's revenue uses historical patterns and real-time indicators, not hunches. This shift from gut feeling to evidence transforms how teams operate. Disagreements get resolved through data instead of whoever speaks loudest. Resources flow toward what actually works instead of what someone thinks might work.
What Metrics Actually Matter
The confidence that comes from evidence-based decisions cascades through an organization because people know their choices rest on reality. However, not all metrics carry equal weight. Organizations need to identify which measurements truly drive strategy forward and which ones just create noise. Revenue growth, customer lifetime value, and operational efficiency metrics form the foundation for most strategic decisions. Teams that track the right indicators (rather than vanity metrics that look good but mean little) gain the clarity needed to allocate resources effectively. The next section explores exactly which metrics separate strategic winners from those still chasing irrelevant numbers.
Which Metrics Actually Drive Your Strategy
The Three Categories That Matter
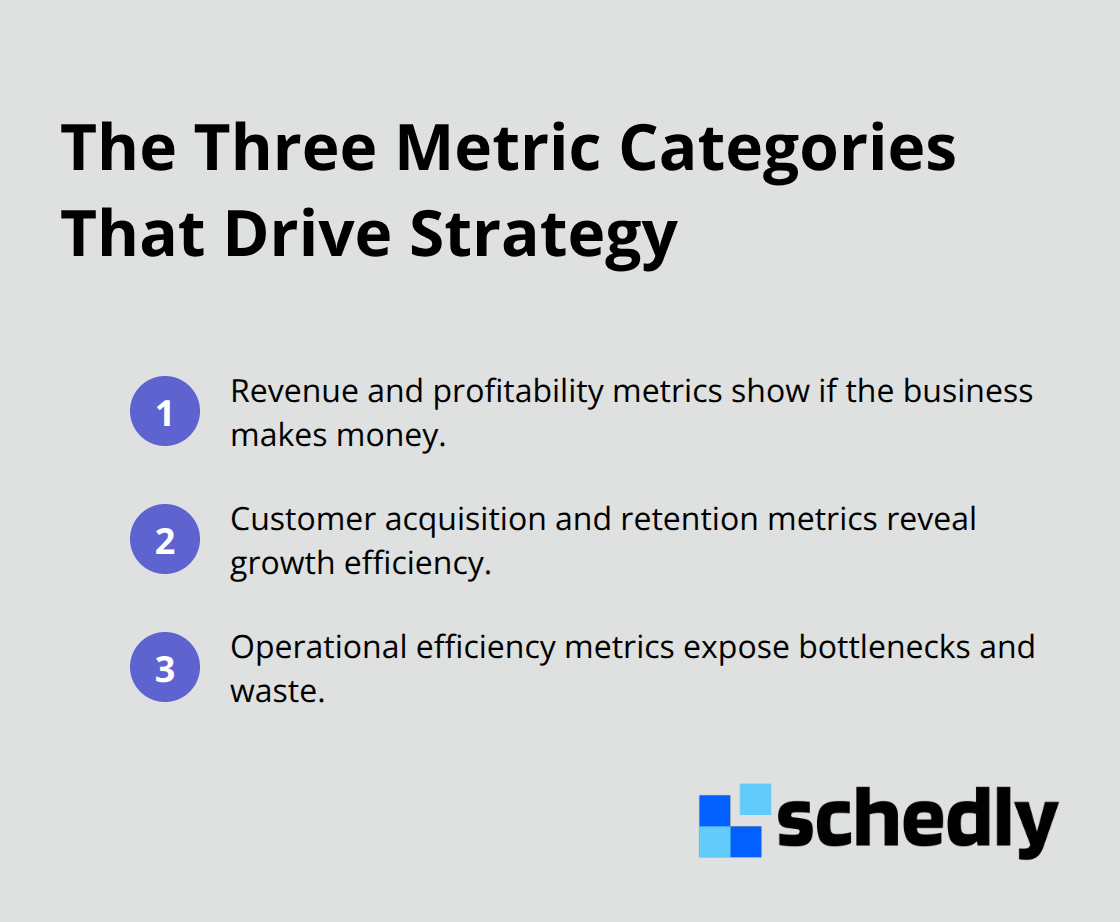
Not every number on a dashboard matters for strategy. The metrics that drive real decisions fall into three categories: those that show whether your business generates money, those that reveal how efficiently you acquire and retain customers, and those that expose operational bottlenecks slowing you down. Revenue growth and profitability form the non-negotiable starting point.
Customer Economics Determine Growth Viability
Customer acquisition cost paired with customer lifetime value determines whether your growth strategy actually works. If you spend $500 to acquire a customer who generates $400 in lifetime value, you destroy shareholder value regardless of how many customers you sign. Nike's supply chain optimization demonstrates why operational metrics matter just as much: the company tracks material availability, demand signals, and distribution performance in real time to reduce costs and shorten delivery times. These three metric categories interconnect. Poor operational efficiency inflates your costs, which directly impacts profitability and forces you to charge higher prices, which increases customer acquisition cost and reduces lifetime value.
Focus on What Actually Moves the Needle
The mistake most organizations make is tracking too many metrics instead of focusing on the few that actually move strategy. Lufthansa centralized its data across more than 550 subsidiaries and discovered that operational efficiency was the primary lever driving profitability. They stopped measuring dozens of secondary indicators and focused relentlessly on the metrics that mattered most. Start by defining what success looks like for your business over the next 12 months. If growth is the priority, customer lifetime value relative to acquisition cost becomes your north star. If profitability matters more, focus on gross margin, operating expense ratios, and which customer segments deliver the highest returns.
Assign Ownership and Review Weekly
If you operate multiple locations or teams, operational efficiency metrics like employee utilization, process cycle time, and resource allocation reveal where money is being wasted. Most importantly, assign someone ownership of each metric and review performance weekly, not monthly or quarterly. Weekly review cycles force the organization to act on data while the insights remain fresh and the window for response remains open. This cadence separates organizations that talk about data-driven decisions from those that actually make them. The metrics you track mean nothing without the systems and people in place to act on them-which brings us to how you build an organization that transforms insights into action.
Building the Systems That Turn Data Into Action
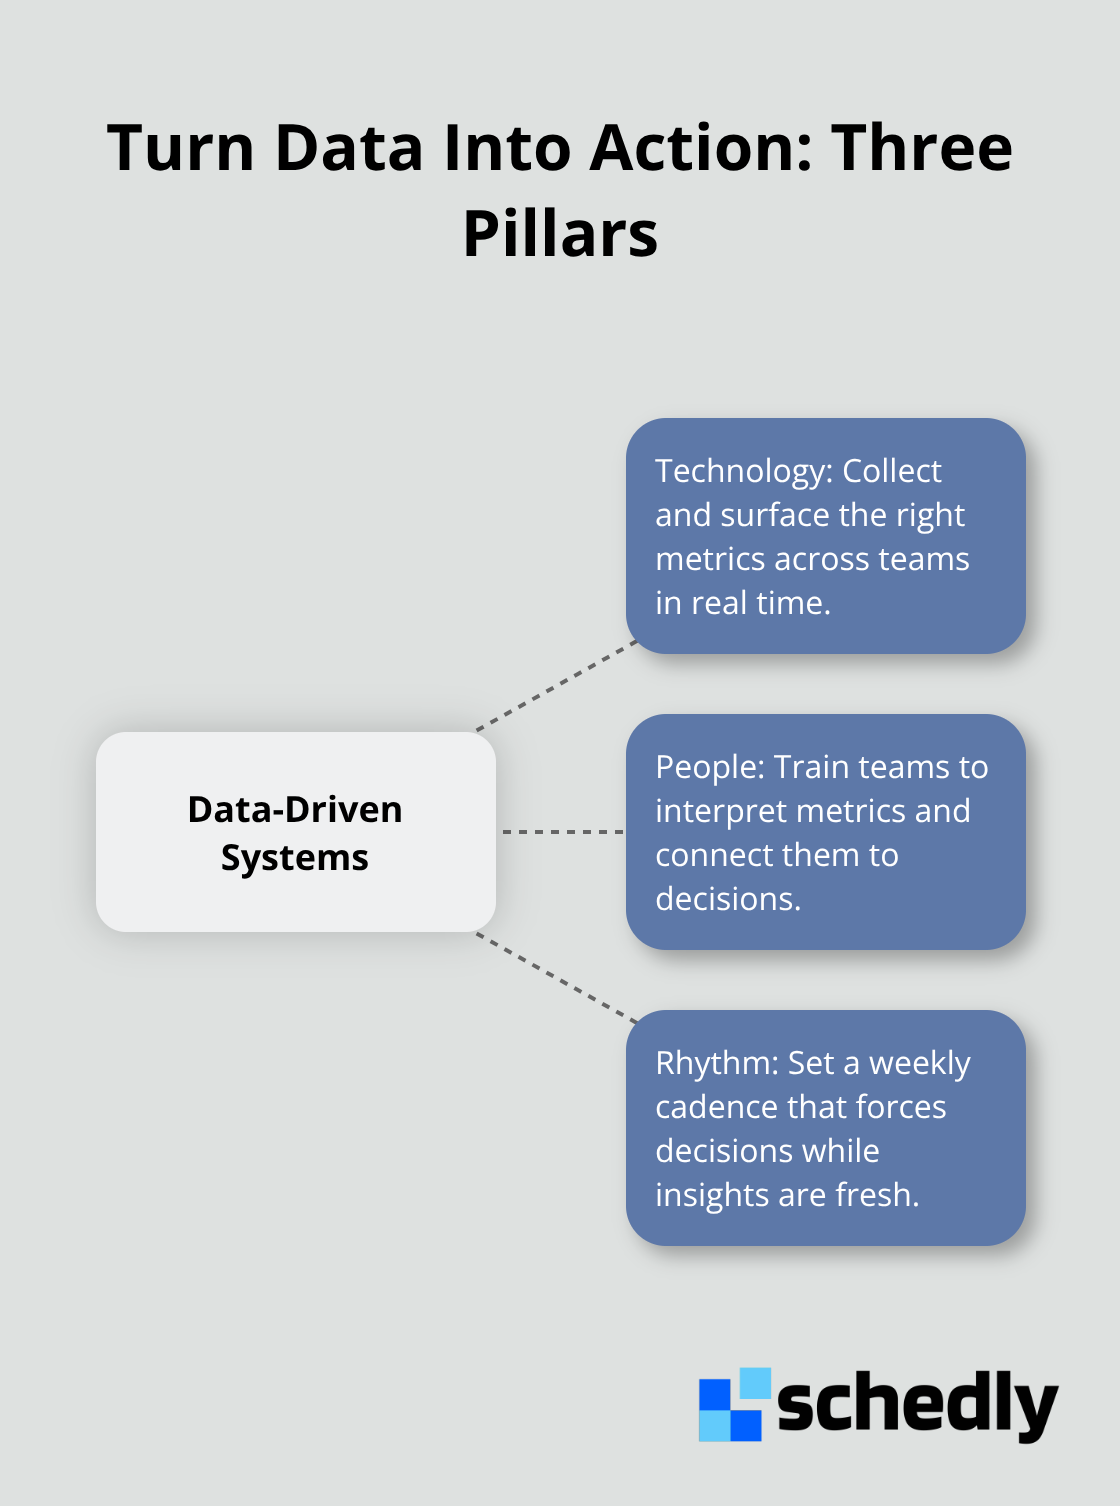
Most organizations fail at data-driven decision-making not because they lack data, but because they lack the infrastructure to act on it. Three things must work together: technology that collects and surfaces the right metrics, people trained to interpret what those metrics mean, and a rhythm that forces weekly decisions based on what you discover.
Technology That Connects Your Data
The tools you choose determine what you can measure and how quickly you can respond. Cloud-based analytics platforms like Tableau or Looker democratize data access across teams, allowing a product manager in one location and a finance director in another to view the same real-time dashboard. This eliminates the common scenario where different departments operate from different versions of reality.
When your scheduling data, customer information, and operational metrics live in separate systems, nobody gets a complete picture. The platform should integrate with your existing tools-Google Calendar, Zoom, Salesforce, payment processors-so data flows automatically rather than requiring manual exports and spreadsheets. This integration matters more than having a fancy interface. A mediocre dashboard fed by real data beats a beautiful dashboard fed by stale information every time.
Train Your People to Read the Data
Technology means nothing without people who understand what the data actually says. Data-driven organizations face significant barriers when teams lack the skills to interpret metrics. A sales manager staring at a dashboard showing declining customer lifetime value needs training to understand whether the problem stems from pricing changes, product quality issues, or customer service failures.
Invest in role-specific training rather than generic analytics courses. A product manager needs to understand cohort analysis and retention curves. A marketer needs to understand customer acquisition cost and attribution. Finance needs to understand forecast accuracy and variance analysis. Most companies spend 2% of their training budget on analytics skills, which explains why dashboards sit unused. Flip this ratio and allocate training resources to the people who interpret metrics and act on them. This training should happen quarterly as your business evolves and new metrics become relevant.
Establish Weekly Decision Rhythms
The final piece is establishing a weekly decision cadence around data. Lufthansa implemented weekly reviews where leadership examined performance metrics and made immediate adjustments to drive operational efficiency. This rhythm forces action. Monthly or quarterly reviews allow insights to become stale and windows for response to close.
Weekly reviews keep the organization moving and ensure data informs decisions while they still matter. Assign one person accountability for each critical metric and require them to present findings every week, explaining what changed, why it changed, and what action the organization should take in response. This cadence separates organizations that talk about data-driven decisions from those that actually make them.
Final Thoughts
The shift from assumption-based strategy to evidence-based decision-making separates organizations that thrive from those that stagnate. Companies measuring performance consistently outperform competitors relying on intuition, and Lufthansa's 30% efficiency gain across 550 subsidiaries proves what becomes possible when data informs every choice. The pattern is unmistakable: organizations prioritizing data-driven decisions gain speed, confidence, and measurable results.
Building this capability requires three interconnected elements. You need technology that surfaces the right metrics in real time, your teams must understand what those metrics actually mean and how to act on them, and you establish weekly rhythms that force decisions while insights remain fresh. Skip any of these and your analytics efforts become expensive dashboards nobody uses. Tools like Schedly help businesses track performance through advanced analytics dashboards that surface key metrics and enable data-driven decisions across your organization.
Start today by defining what success looks like for your business over the next 12 months and identify which three to five metrics will tell you whether you're winning. Assign ownership of each metric to a specific person and require that person to explain what changed, why it changed, and what action your organization should take in response. The organizations winning today aren't smarter than their competitors-they're simply more disciplined about measuring what matters and acting on what they discover.