
Schedly resources
Data Driven Decisions That Transform SMB Growth
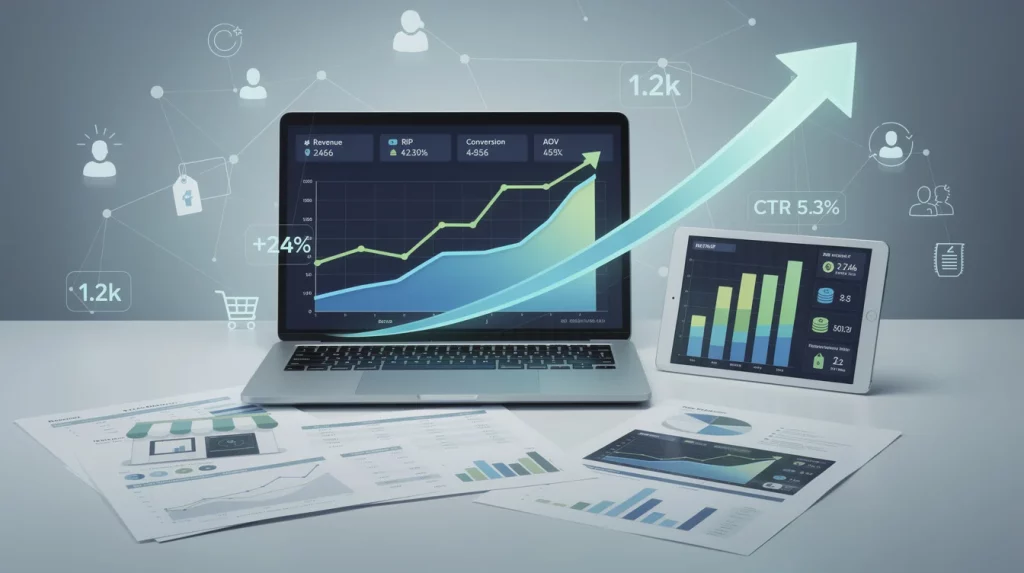
Most small business owners make decisions based on gut feeling rather than facts. This approach costs money and slows growth.
At Schedly, we've seen firsthand how data-driven decisions transform SMBs. The businesses that win are the ones measuring what actually works, not guessing.
Why Most SMBs Never See Their Data
The reality is stark. A Deloitte study found that small businesses using data analytics are 5 to 6 percent more productive than competitors who don't. Yet most SMBs still operate in the dark, making decisions based on what feels right rather than what the numbers show. This productivity gap compounds over time. When a competitor starts tracking which products generate the highest margins or which customer segments have the lowest churn, they pull ahead while you're still guessing.
Data Exists Everywhere-But It's Trapped
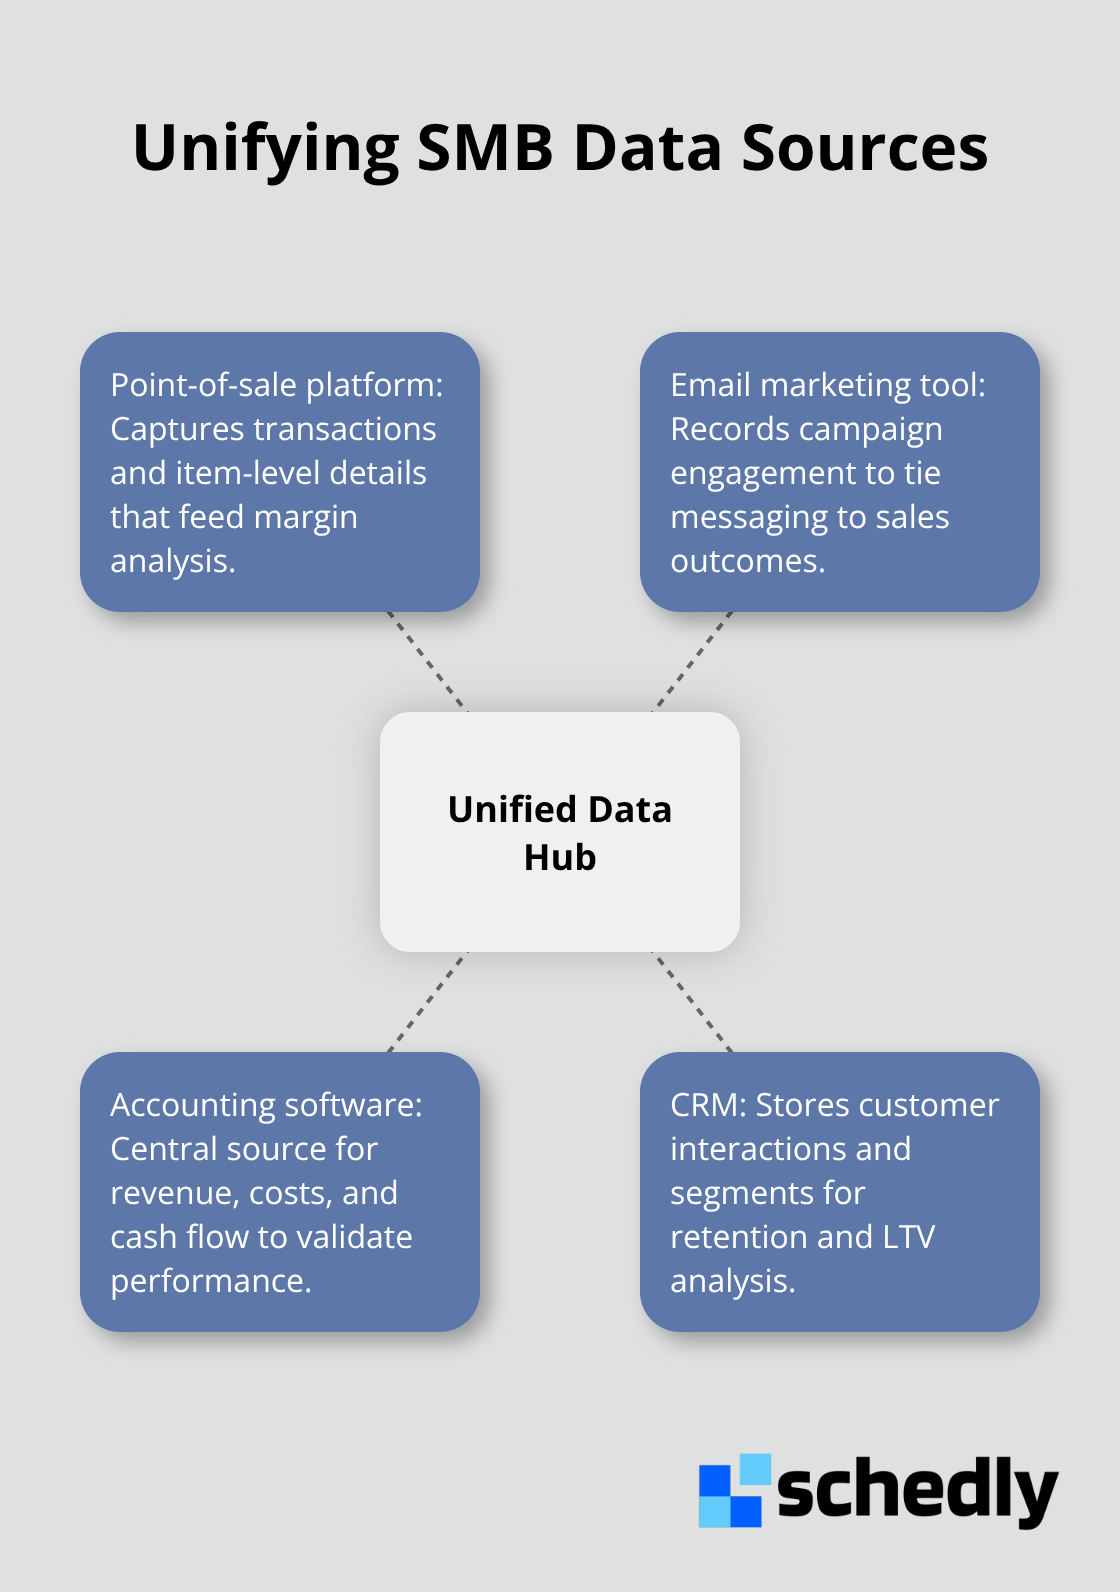
The problem isn't that SMBs lack access to data. You generate it constantly. Every transaction, every customer interaction, every marketing campaign produces information. The real problem is that this data sits scattered across disconnected systems: your point-of-sale platform, your email marketing tool, your accounting software, maybe a CRM if you're ahead of the curve. Without pulling it together into one place, the data becomes useless.
The Myth of Expensive Solutions
Most SMB owners assume they need massive budgets and technical teams to make data work. This myth keeps them stuck. Tools like Google Analytics cost nothing. Platforms like Power BI and Tableau offer affordable plans designed specifically for small teams.
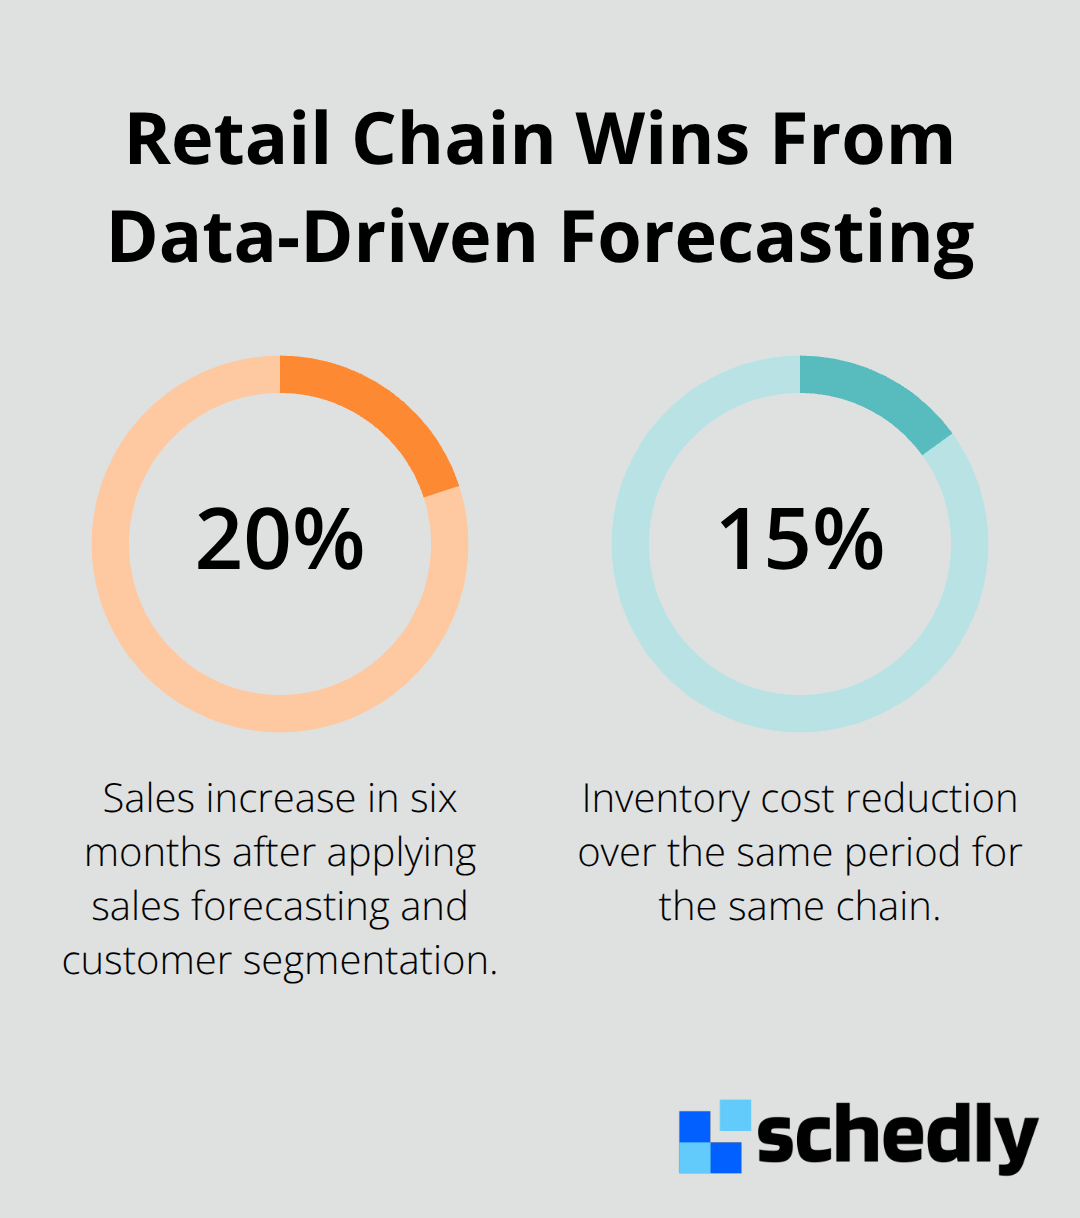
A three-location retail chain improved sales by 20 percent and cut inventory costs by 15 percent in just six months after applying sales forecasting and customer segmentation. They didn't hire data scientists. They consolidated data from their POS system and e-commerce platform, then used straightforward time-series forecasting to predict demand.
Expertise Is More Accessible Than You Think
The expertise gap is also overstated. Data literacy isn't some exclusive skill. Most SMB team members can learn to read a dashboard and act on what it shows. What's missing is usually a clear starting point and permission to experiment. The businesses that win are the ones who stop waiting for perfect conditions and start measuring one thing well.
Once you see results from that first metric, momentum builds. Your team starts asking better questions. You naturally move toward more sophisticated analysis. The gap between data-driven SMBs and intuition-driven ones keeps widening, and the cost of waiting only increases.
What Comes Next
The tools exist. The data exists. What separates winners from the rest is action-and knowing exactly which metrics to track first.
Where Data Reveals What's Actually Working
Data transforms vague hunches into concrete facts about your business. Instead of wondering which products drive real profit, you measure it. Instead of guessing which customers stay loyal, you track retention by segment. Instead of hoping your marketing spend converts, you monitor every dollar's impact. This shift from assumption to measurement is where SMB growth accelerates.
Which Products and Services Actually Make Money
Most SMB owners know their revenue but not their margins. You might sell ten products, but three of them probably generate 80 percent of your profit. The other seven consume time and resources while masking the truth. Small businesses leveraging data analytics effectively see measurable improvements in business performance. The difference starts with knowing what to measure.
Pull transaction data from your accounting software and POS system. Calculate gross margin for each product line. Then segment by customer type, season, and sales channel. You'll discover patterns you never saw before. Maybe your highest-revenue product has razor-thin margins. Maybe a low-volume service attracts your most loyal customers and generates repeat business.
These insights change how you allocate inventory, staff time, and marketing budget. Stop promoting everything equally. Double down on what actually works. A fashion e-commerce startup improved website conversion using web analytics and A/B testing, demonstrating how measurement-driven optimization drives growth. They didn't guess which product features mattered. They tested variations, measured results, and scaled what converted.
Understanding Who Your Customers Really Are
Customer behavior data reveals patterns invisible to intuition alone. Which segments have the highest lifetime value? Which ones churn fastest? Which acquisition channels bring your most profitable customers? Consolidate data from your CRM, email platform, and transaction history into one view to answer these questions.
Start with segmenting customers by purchase frequency, average order value, and time since last purchase. Layer in demographic data if you have it. Then measure retention rates for each segment. You'll find that some customer groups stay with you for years while others disappear after one transaction. This distinction matters enormously.
Retaining a customer costs far less than acquiring a new one. Once you identify your high-value segments, you can tailor messaging and offers specifically for them. Personalization at scale becomes possible. An email campaign that speaks to repeat customers differently than first-time buyers outperforms generic messaging every time. Tools like Google Analytics and HubSpot make this segmentation straightforward. Set up custom audiences based on behavior, then measure how different messaging performs with each group. Optimize pricing, product recommendations, and communication cadence for each segment.
Spending Money Only Where It Works
Marketing budgets disappear into channels that don't convert. Without tracking, you waste resources on habits rather than results. Measure customer acquisition cost for every channel. Track which sources bring customers with the highest lifetime value. Allocate budget to channels delivering the lowest cost per profitable customer, not just the lowest cost per click.
This requires connecting marketing data to actual sales outcomes. If you run ads on multiple platforms, set up conversion tracking on each one. Measure not just clicks but completed purchases or qualified leads. Companies using analytics effectively improve their ability to forecast and allocate resources strategically.
Start with one high-spend channel and measure it thoroughly. Calculate how much you spent and what revenue resulted. Include customer acquisition cost, customer lifetime value, and payback period. Once you have baseline data, test variations. Change your ad copy, targeting, or offer. Measure the impact. Double down on what improves results. Cut what doesn't. This iterative approach transforms marketing from a cost center into a profit center. You stop guessing and start optimizing, which means your next challenge is knowing which metrics to track first and how to organize your team around them.
Start Measuring Today Without the Complexity
Most SMBs delay action while waiting for the perfect analytics setup. This is a mistake. You don't need enterprise software or a data team to begin. Google Analytics costs nothing and tracks website visitor behavior, traffic sources, and conversion paths with precision. Set it up in under an hour and create goals for key actions: newsletter signups, product purchases, contact form submissions. Within days you'll see which pages convert visitors and which ones leak traffic. Pair this with Google Data Studio to build a simple dashboard showing daily traffic, conversion rate, and revenue. Your team sees the same metrics every morning, which creates accountability and starts the data conversation.
Measure What Matters Without Overcomplicating It
For transaction-based businesses, export your accounting software data monthly into a spreadsheet and calculate three metrics: total revenue, average transaction value, and customer count. These three numbers reveal growth patterns immediately. If revenue grows but customer count stays flat, your existing customers are spending more. If customer count grows but average value drops, you're attracting price-sensitive buyers. This distinction changes how you allocate resources.
The fashion e-commerce startup mentioned earlier didn't use advanced tools initially. They used Google Analytics to identify which product pages had high traffic but low conversion. Then they tested different product descriptions and images on those pages. Conversion improved from 1% to 4% in months. No complex analytics infrastructure required. The real work is defining which metrics matter for your specific business, not selecting software.
Choose Metrics That Connect to Revenue
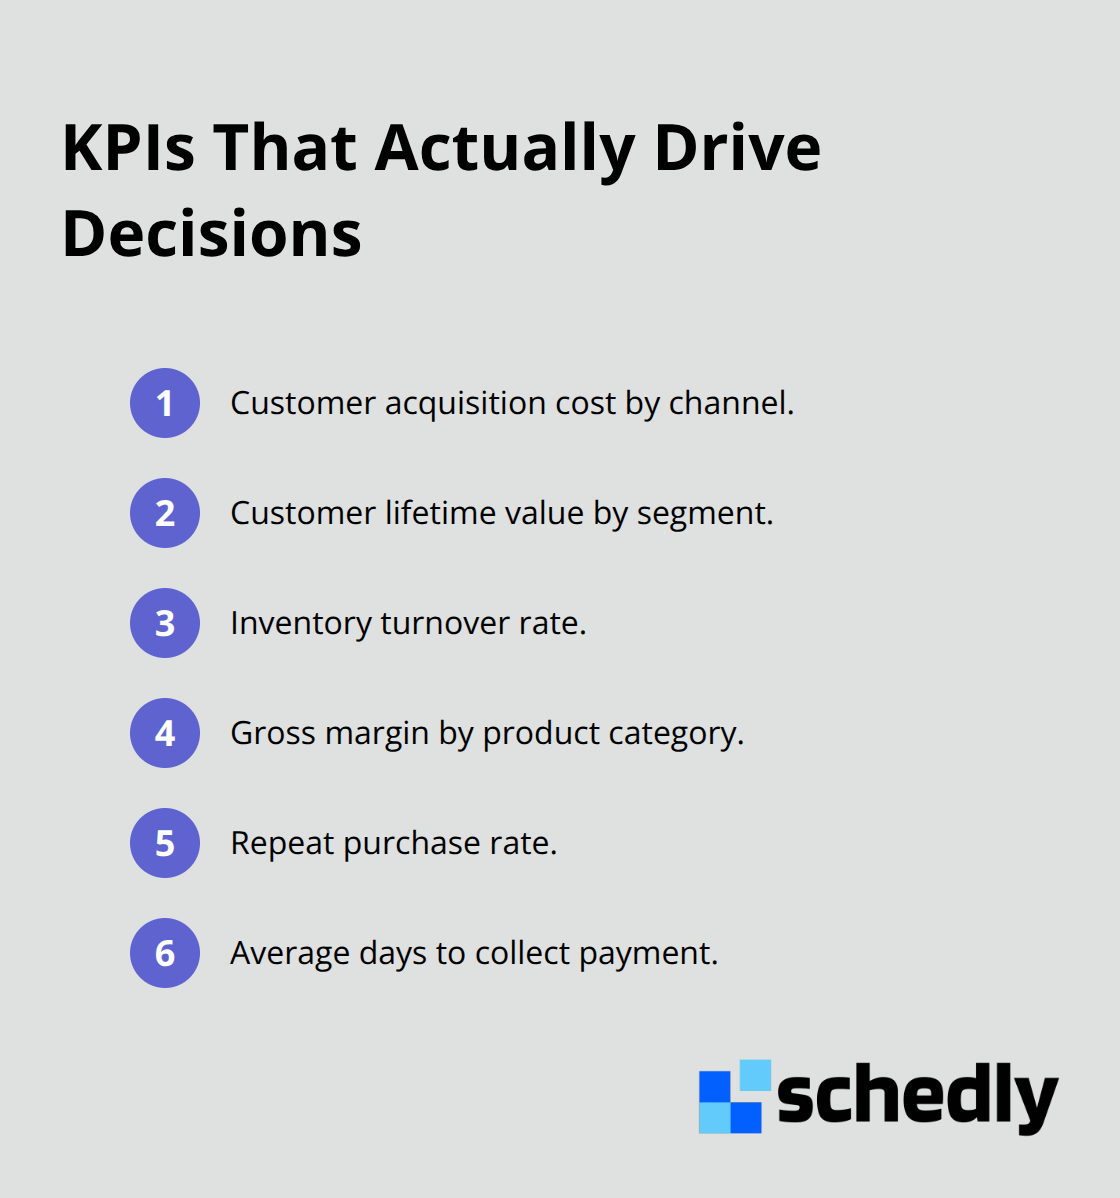
Key performance indicators must connect directly to revenue or cost reduction. Vanity metrics like total website visitors or social media followers feel good but don't drive decisions. Instead, track metrics that reveal business health: customer acquisition cost by channel, customer lifetime value by segment, inventory turnover rate, gross margin by product category, repeat purchase rate, and average days to collect payment.
Start with three metrics maximum. Measure them consistently for six weeks before adding more. This forces discipline and prevents metric overload. Tools like Google Analytics and basic spreadsheets work fine for this phase. The goal is consistency, not sophistication.
Build a Weekly Review Routine
Create a standing weekly meeting where your team reviews the previous week's numbers for fifteen minutes. One person presents the data. Everyone discusses what changed and why. What marketing campaign ran last week? Did sales spike? Did a competitor launch something new? Did seasonality shift? This weekly review routine transforms data from a reporting exercise into a thinking tool.
The retail chain that improved sales by 20% didn't hire consultants. They assigned one person to review sales forecasts and inventory levels every Monday morning, then communicated findings to the buying and operations teams. That single thirty-minute meeting prevented stockouts and overstock situations. Consistency matters more than sophistication.
Stick With Your Tools Long Enough to See Results
Track the same metrics the same way every week. When you see a trend, you can act on it. When metrics change randomly because you measure differently each time, you can't trust what you're seeing. Pick your tools and stick with them for at least three months before switching. This stability lets patterns emerge and lets your team develop confidence in what the numbers actually mean.
Final Thoughts
The gap between data-driven SMBs and those operating on intuition widens every quarter. A SAP study showed that small businesses leveraging data analytics effectively see revenue growth rates 123 percent higher than those that don't. This advantage compounds as you measure what works and abandon what doesn't.
You don't need perfect conditions to start making data-driven decisions. One metric, one tool, and one weekly review meeting suffice to transform how you operate. Google Analytics costs nothing, a spreadsheet works fine, and your first dashboard takes hours to build. Within six weeks you'll have insights that change how you allocate resources and where you invest next.
If your business involves scheduling, booking, or customer appointments, Schedly's analytics dashboard helps you track performance metrics and make decisions based on real data about your operations. Start measuring this week and watch your competitive position strengthen.