
Schedly resources
"KPI tracking dashboard": Visualize Growth With a KPI Tracking Dashboard
Most businesses are drowning in data but starving for insights. A KPI tracking dashboard cuts through the noise by showing you exactly what matters-in real time.
At Schedly, we've seen firsthand how teams that monitor the right metrics make faster, smarter decisions. Without visibility into your key performance indicators, you're essentially flying blind.
Why Your Business Needs Real-Time Performance Visibility
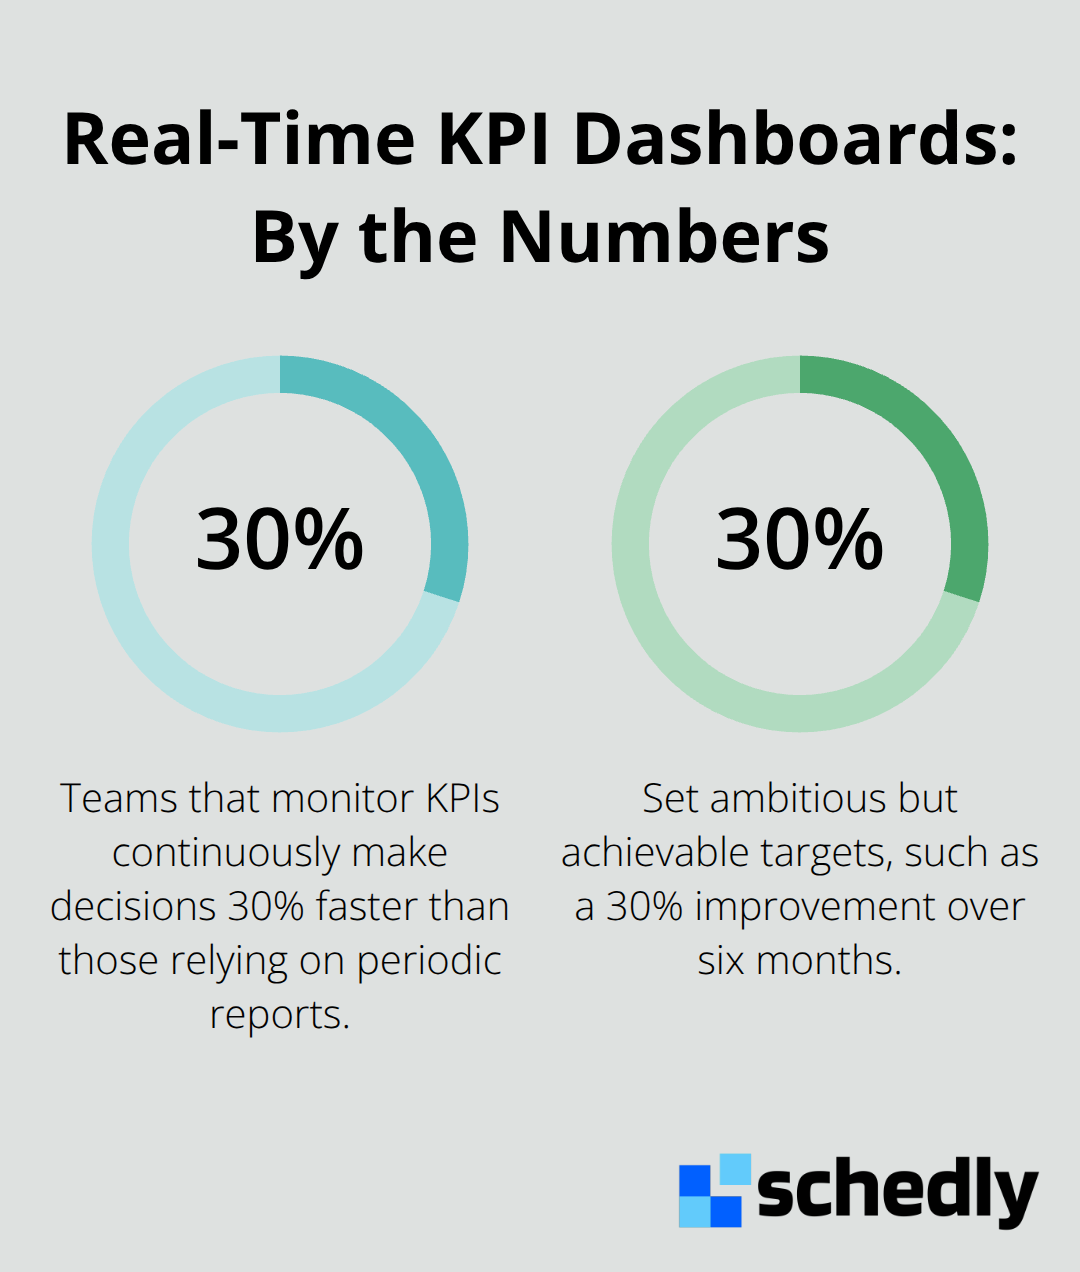
Most companies check their performance metrics monthly or quarterly, which means they're already weeks or months behind on critical decisions. Real-time KPI dashboards eliminate this lag entirely. When you can see your revenue, customer acquisition costs, and operational efficiency update throughout the day, you spot problems before they become expensive and capitalize on opportunities while they're still fresh. Teams that monitor KPIs continuously make decisions 30% faster than those relying on periodic reports. The difference matters most during market shifts or unexpected drops in performance.
Speed and Accuracy in Decision-Making
Data-driven decisions outperform gut-feel decisions consistently, yet most teams still operate on assumptions. When you have a dashboard displaying your actual metrics-conversion rates, customer lifetime value, cash flow, employee productivity-your team stops debating what might be true and starts acting on what is true. This shifts conversations from opinion-based to fact-based almost immediately. The impact compounds quickly: teams using centralized KPI dashboards establish long-term performance tracking habits at nearly three times the rate of those without them. That's not just about better individual decisions; it's about building an organization where data literacy becomes standard. Your marketing team can see which channels actually deliver the best return on ad spend rather than relying on channel managers' claims. Your operations team can identify bottlenecks in days instead of months. Your leadership can allocate budget to initiatives that genuinely move the needle.
Catching Problems Before They Escalate
Early warning systems are invaluable in business. When your customer retention rate drops even slightly, a good KPI dashboard highlights it immediately, so you can investigate and respond before churn accelerates. The same applies to cash flow pressure, inventory buildup, or declining employee engagement. Problems that remain hidden cause damage. A dashboard that tracks your key metrics continuously acts as an early detection system, letting you adjust strategy before situations become critical. This proactive approach reduces crisis management and gives you the breathing room to make thoughtful decisions rather than desperate ones.
Moving From Reactive to Proactive Management
Most organizations react to problems after they surface. Real-time dashboards flip this dynamic entirely. You shift from asking "What went wrong?" to asking "What's about to go wrong?" This distinction transforms how you operate. Your team responds to trends instead of crises, adjusts tactics while they still matter, and prevents small issues from snowballing into major setbacks. The visibility that a KPI dashboard provides means your business moves at the speed of data, not the speed of your next meeting. With this foundation in place, the next step involves selecting the right metrics and features that actually drive results for your specific business.
What Makes a Dashboard Actually Useful
A dashboard packed with every metric imaginable becomes useless fast. The problem isn't too little information-it's too much noise drowning out signal. An effective KPI tracking dashboard strips away vanity metrics and focuses exclusively on measurements that directly influence your business outcomes. This means your revenue growth rate, customer acquisition cost by channel, retention rate, and cash flow matter. Your total page views or follower count do not.
Focus on What Actually Drives Results
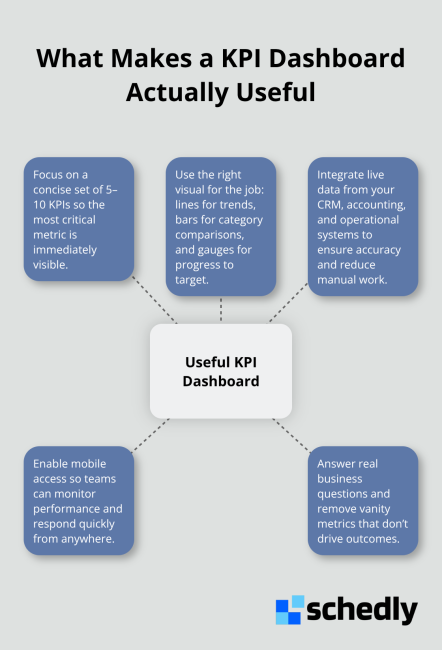
The best dashboards contain between five and ten KPIs maximum, arranged so the most critical metric dominates your screen immediately. When you can see your revenue trend, CAC, and customer lifetime value at a glance, you make smarter decisions about marketing spend and growth strategy. Anything beyond this core set becomes distraction. The visualization matters enormously too. A poorly chosen chart obscures patterns rather than revealing them. A line graph works for trends over time, a bar chart compares categories, and a gauge shows progress toward a target. Avoid 3D charts and decorative elements that look impressive but add zero analytical value.
Your dashboard should answer specific questions your team actually asks: Are we on track to hit quarterly revenue? Which marketing channels deliver the lowest acquisition cost? Is our cash runway improving or deteriorating? If a visualization doesn't answer a real business question, remove it.
Connect Your Data Sources Directly
The second critical feature is integration with your existing systems. Your KPI dashboard means nothing if data arrives manually or stale. When your dashboard pulls live data directly from your CRM, accounting software, and operational systems, metrics update automatically throughout the day. This eliminates spreadsheet errors, reduces manual work, and ensures everyone works from the same numbers.
Enable Access Anywhere Your Team Works
Mobile access transforms how your team uses dashboards too. Your operations manager shouldn't need to sit at a desk to check whether today's production targets are on pace. Your sales leader shouldn't wait until returning to the office to see if the pipeline shifted. A mobile-responsive dashboard means your team monitors performance from job sites, client meetings, or anywhere else they operate. This accessibility drives actual usage. Teams that can check metrics on their phone check them more frequently, spot problems faster, and respond more quickly to opportunities. The difference between a dashboard sitting on someone's desk and one they can access in their pocket is the difference between a reporting tool and a decision-making tool.
With the right metrics, integrations, and mobile access in place, you need a clear process for selecting which KPIs actually matter for your business and how to establish targets that push your organization forward.
Setting Up KPIs That Actually Move Your Business
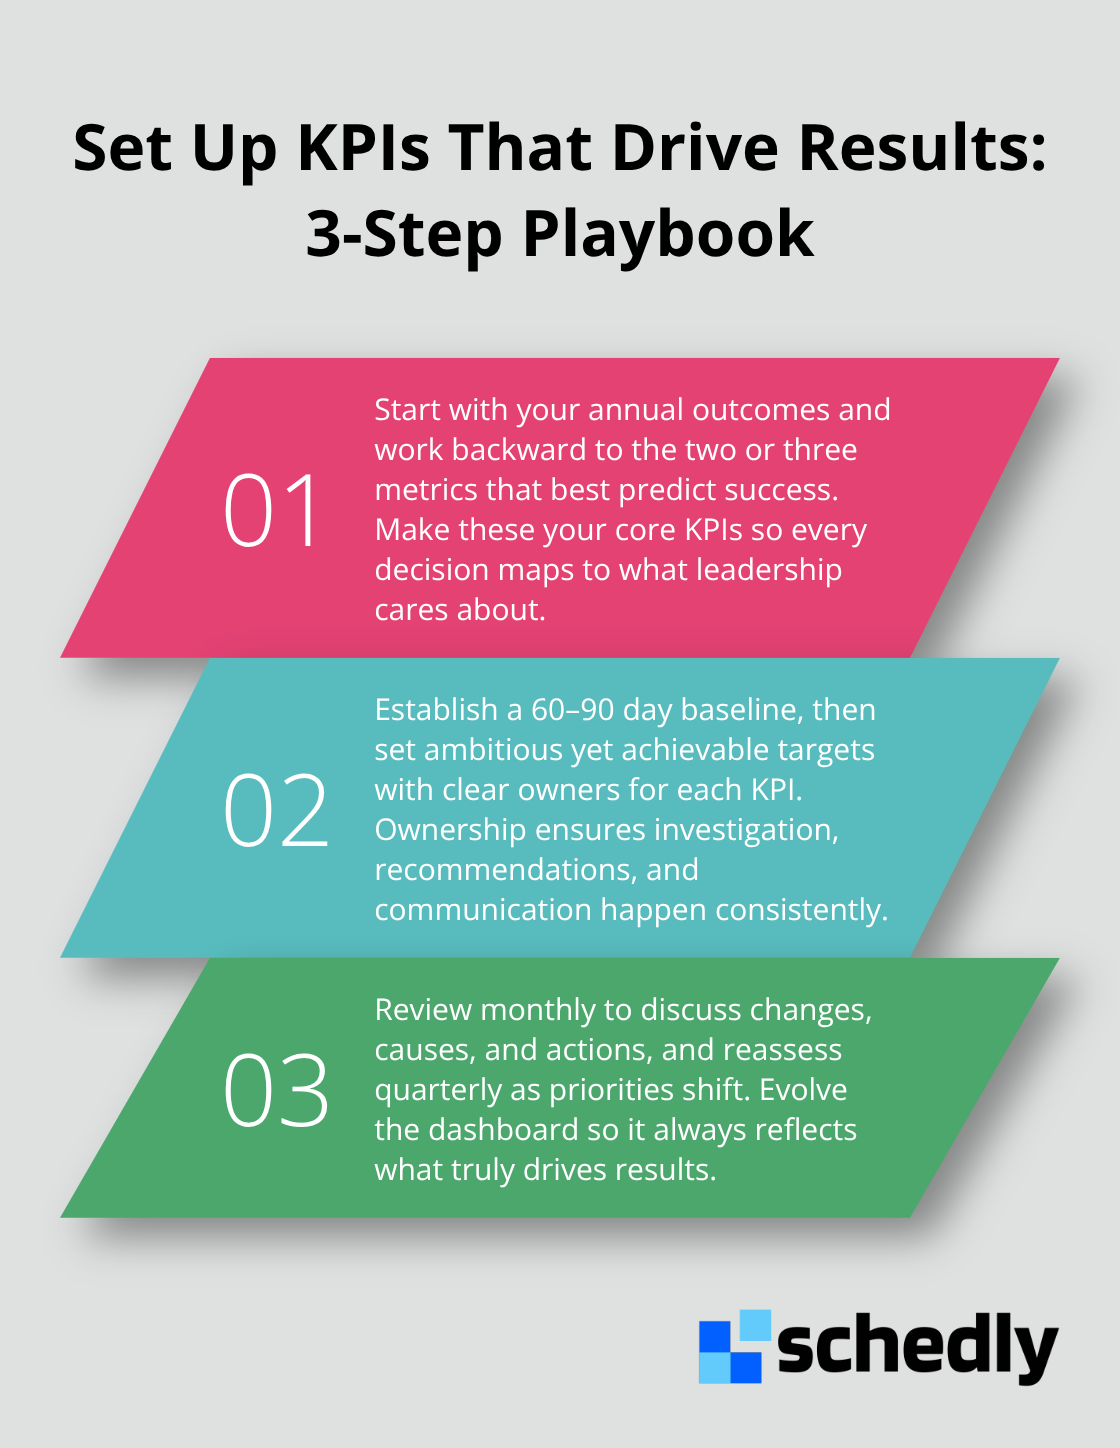
Start with your annual business plan. What outcomes does your leadership team care about hitting? Write those down. Then work backward to identify which two or three metrics predict whether you'll hit those outcomes. Those become your core KPIs. A manufacturing business should measure machine downtime, cycle time per unit, and throughput. A marketing agency should track revenue per client, project margin, and client retention. The specificity matters enormously because generic KPI lists from templates ignore your actual business model.
Select Metrics That Connect to Real Business Outcomes
Most teams treat all metrics equally, which is a critical mistake. Your revenue growth rate matters infinitely more than your website bounce rate, yet both often end up on the same dashboard competing for attention. If you're a SaaS company, revenue growth rate, customer acquisition cost by channel, and customer lifetime value form your foundation. If you run a service business, focus on revenue per employee, project profitability, and client retention rate. Start with three to five metrics that directly connect to your core business objective. Anything beyond this core set becomes distraction rather than insight.
Establish Baselines and Set Targets That Work
Once you've selected your metrics, collect sixty to ninety days of historical data to establish a baseline. This baseline becomes your reference point for everything that follows. If your current customer acquisition cost is forty-five dollars and your industry average is thirty-five dollars, you now know you're underperforming.
Review Your Dashboard Consistently
Schedule monthly reviews where the team discusses what changed, why it changed, and what actions that insight demands. Most dashboards fail not because the metrics are wrong but because nobody reviews them consistently. If your customer retention rate dropped two percentage points, that conversation needs to happen immediately, not when someone remembers to check the dashboard. During these reviews, your team stops debating what might be true and starts acting on what is true.
Reassess KPIs as Your Business Evolves
Quarterly, reassess whether your KPIs still align with your business priorities. Market conditions shift, competitors emerge, and strategic focus changes. A KPI that mattered intensely six months ago might matter less today. Stale metrics create stale decisions. The dashboard itself should evolve as your business evolves, ensuring your team always tracks what actually drives results.
Final Thoughts
A KPI tracking dashboard transforms how your business operates by replacing guesswork with facts. Your team makes faster decisions, spots problems before they escalate, and allocates resources to initiatives that genuinely move the needle. Implementation starts small: pick three to five metrics that connect directly to your core business objective, establish baselines, and assign ownership to each metric.
Consistency determines whether your dashboard becomes a decision-making tool or a forgotten reporting system. Schedule monthly reviews where your team discusses what changed, why it changed, and what actions that insight demands. Most dashboards fail not because the metrics are wrong but because teams never review them consistently, allowing stale data to drive stale decisions.
As your business evolves, your KPI tracking dashboard evolves with it-quarterly reassessments keep your metrics aligned with shifting priorities and market conditions. Schedly's analytics dashboard helps you track key metrics and make data-driven decisions about your operations, so start building your dashboard today and watch how visibility transforms your decision-making speed.