
Schedly resources
Multi Location Analytics That Inform Your Growth Strategy

Running multiple locations means juggling different performance levels, customer behaviors, and operational costs across each site. Without multi-location analytics, you're making growth decisions based on incomplete information.
At Schedly, we've seen businesses waste resources expanding to the wrong locations or failing to capitalize on their strongest performers. The right data transforms how you allocate budgets, test new offerings, and scale strategically.
Why Multi-Location Analytics Transform Growth Decisions
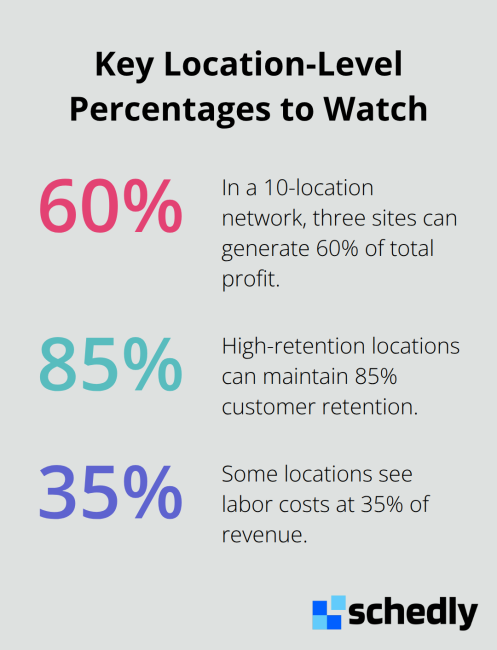
Without visibility into how each location performs, you're operating blind. Most businesses running multiple sites track revenue in a spreadsheet and call it analytics. This approach costs you money. According to research from Forrester, data-driven organizations make decisions 5 times faster than their competitors. When you have real-time performance data across all locations, you stop guessing about where to invest next. You see which sites generate the highest revenue per square foot, which ones attract repeat customers, and which drain resources without delivering returns. A business with 10 locations might discover that three sites account for 60% of profit while two others consistently underperform. That insight alone changes everything about your expansion strategy.
The Cost of Operating Without Location-Level Visibility
Most multi-location businesses struggle with data fragmentation. Store managers use different tools, track metrics differently, and report numbers that don't align across the network. This creates what industry experts call the platform silence problem-different marketing tools use different metrics, making it impossible to compare locations fairly. You end up spending hours normalizing data just to answer simple questions. The real problem is that this delay costs you money. While you're waiting for reports, competitors already reallocate budgets to their top performers and test new offerings in their strongest markets.
Spotting Opportunities Before They Disappear
Location-specific data reveals patterns you'd never see from a bird's-eye view. One location might show declining customer retention while another in the same region shows growth. One site might have high foot traffic but low conversion rates, signaling an operational or service issue. Another might be a consistent profit generator that deserves more investment. The businesses that win act on these insights fast. They identify their top performers within weeks, not months, and double down on what works. They spot underperformers early enough to fix problems or make the tough decision to close or restructure.
Research shows that foot traffic analytics combined with location intelligence help growth teams optimize expansion by aligning consumer preferences with market strengths. This means you're not just reacting to performance data-you're using it to predict which new markets will succeed before you invest capital. The next step is identifying which specific metrics matter most for your business and how to track them consistently across every site.
What Metrics Actually Matter for Multi-Location Growth
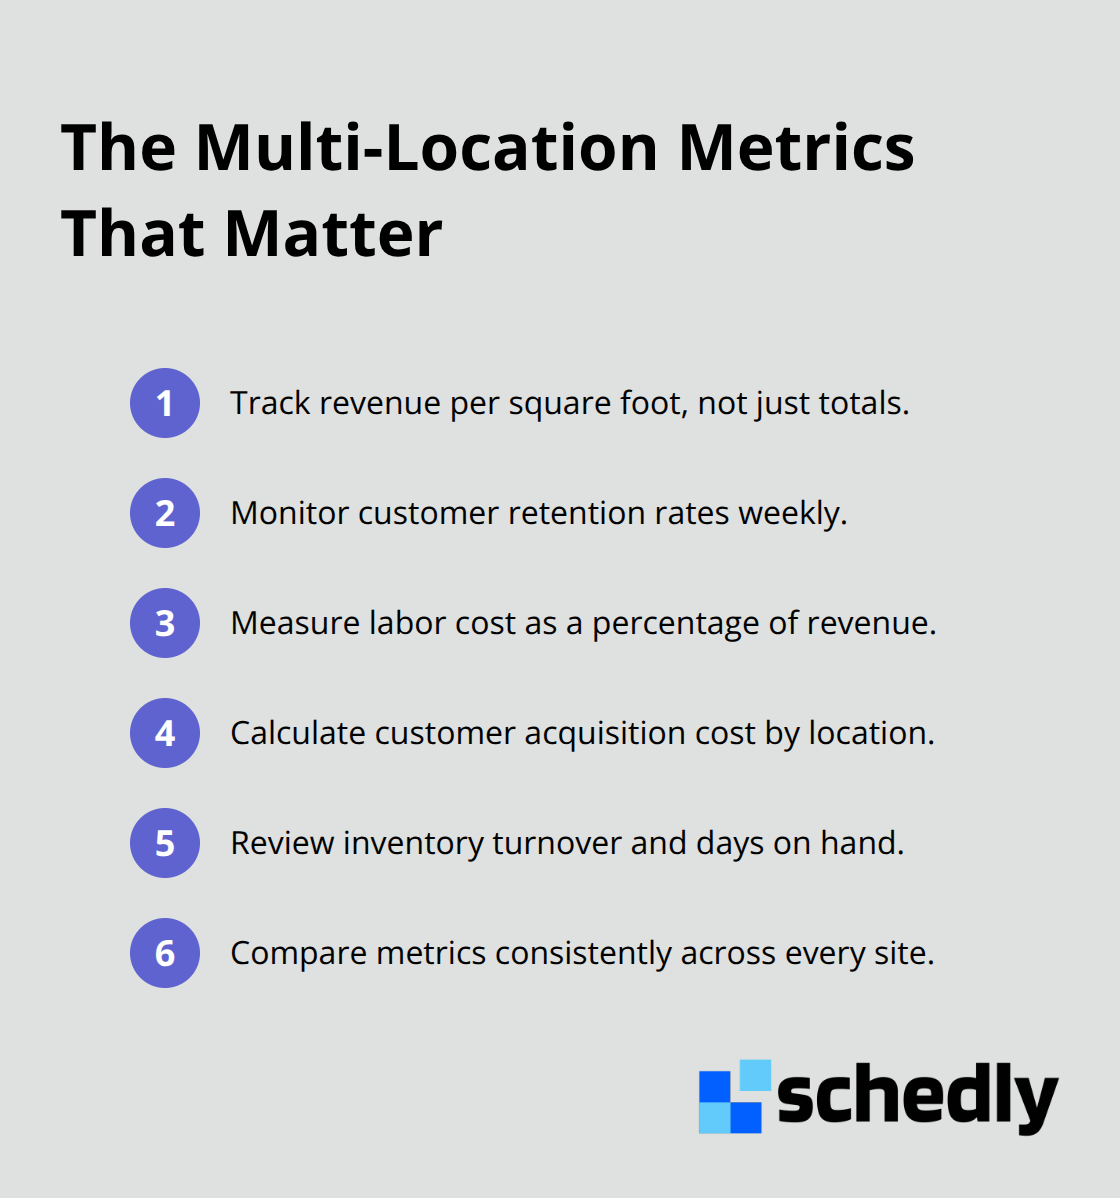
Revenue per square foot, customer retention rates, and labor costs per transaction separate growth-focused businesses from those treading water. Most multi-location operators track revenue totals and stop there. This misses the point entirely. Revenue tells you how much money came in, not whether each location actually operates efficiently or justifies the space it occupies.
Revenue Per Square Foot Reveals True Productivity
A location generating $500,000 annually might underperform if it requires 5,000 square feet, while another location doing $400,000 in 2,000 square feet operates as a cash machine. Revenue per square foot forces you to see which locations truly produce and which consume resources without justification. This metric transforms how you evaluate expansion candidates and decide which underperforming sites need restructuring or closure.
Customer Acquisition Cost Exposes Market Efficiency
Customer acquisition cost by location matters far more than total acquisition spend. If one location acquires customers for $45 while another spends $120 per customer, the difference compounds quickly across dozens of locations and hundreds of acquisitions monthly. This metric reveals which markets naturally accept your offering and which require expensive marketing interventions to generate identical results. Markets with high acquisition costs signal either weak product-market fit or intense local competition that demands strategic attention.
Retention Rates Uncover Operational Problems
Weekly customer retention rates demand location-specific tracking because they expose operational problems aggregate data hides. A location with 60% monthly retention bleeds customers due to service quality, staff turnover, or product-market fit issues in that specific market. Another location maintaining 85% retention operates at a fundamentally different efficiency level. The businesses scaling fastest track these rates weekly, not quarterly, because weekly data triggers faster corrective action.
Labor Costs and Inventory Reveal Operational Lean
Operational efficiency metrics like labor cost as a percentage of revenue and inventory turnover by location reveal which sites run lean operations and which carry excess overhead. A location where labor costs 35% of revenue versus 28% at another site signals either staffing problems, scheduling inefficiency, or lower-volume periods that need restructuring. A location carrying 60 days of inventory while another maintains 35 days reveals capital tied up unnecessarily. These gaps compound across your network, draining profitability that could fund expansion into stronger markets.
Acting on Location-Level Data Drives Competitive Advantage
The businesses that grow profitably act on this data immediately, reallocating staff from underperforming sites to high-potential locations or restructuring schedules to match demand patterns. Without location-level visibility into these specific metrics, you make capital allocation decisions on incomplete information while competitors who track meticulously already reposition resources toward their winners. The next step involves establishing a reporting system that delivers these metrics consistently across all locations, enabling you to spot patterns and act before opportunities shift.
How to Use Location Data to Sharpen Your Expansion Strategy
Benchmark Performance Across Your Network
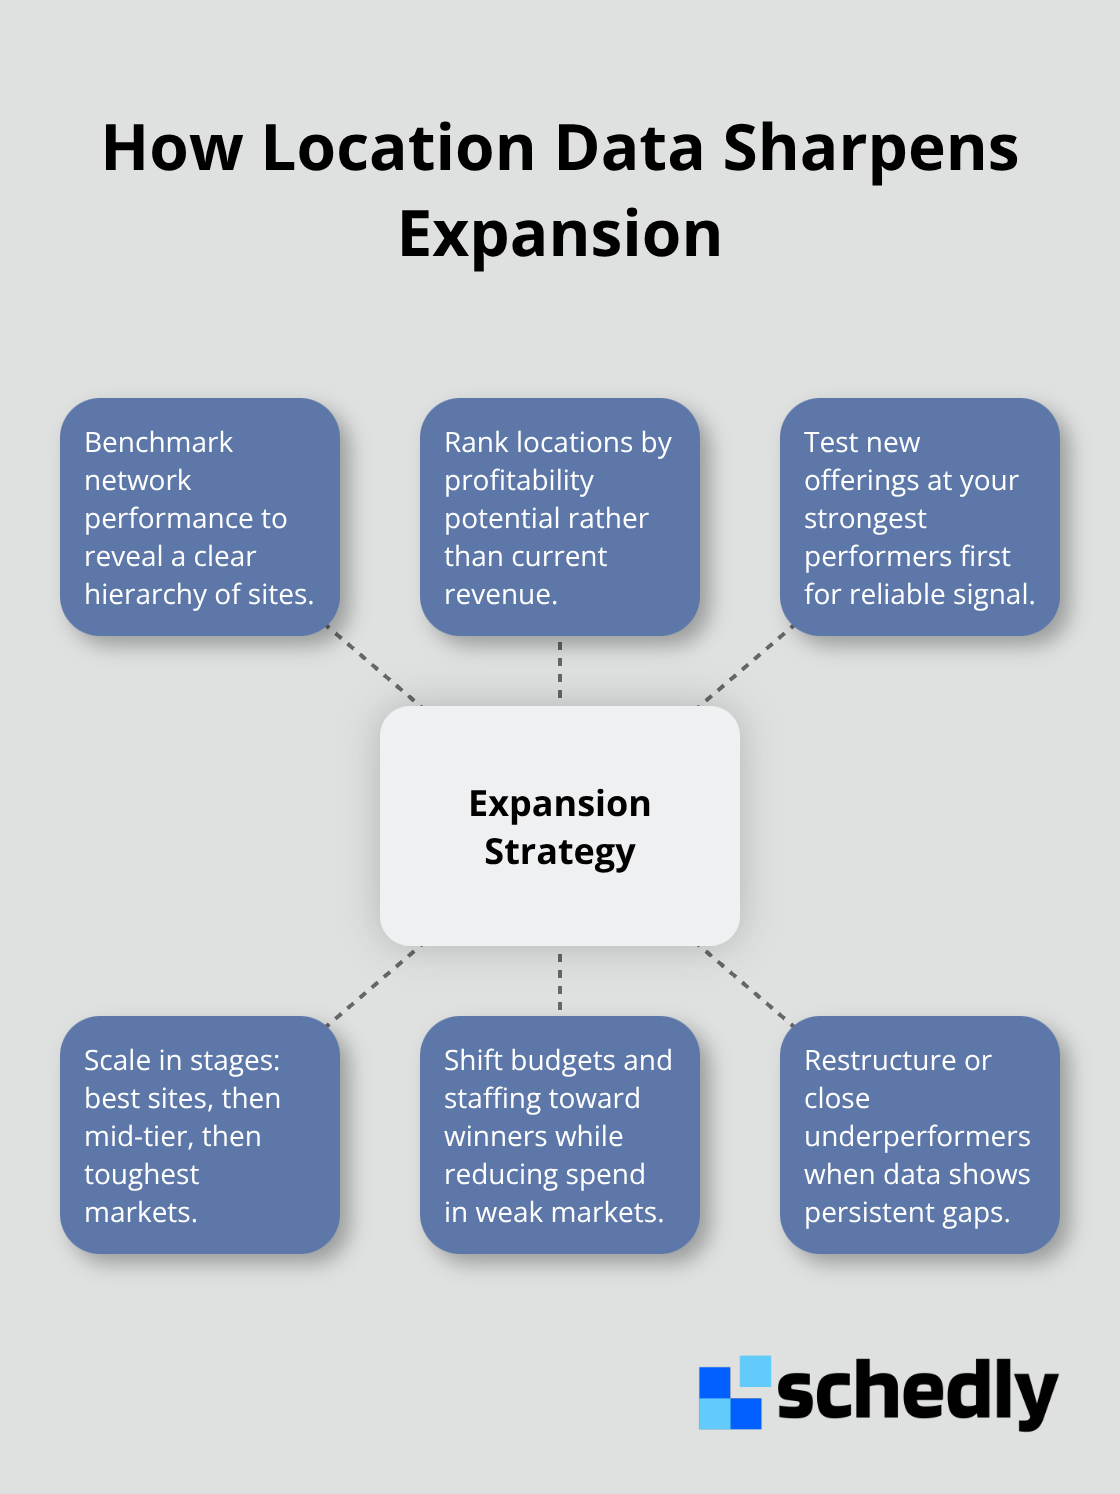
The real power of multi-location analytics emerges when you stop treating each location as an isolated unit and start comparing performance systematically. Benchmarking across locations creates a performance hierarchy that reveals which sites operate as templates for growth and which ones signal problems in specific markets. Start by comparing revenue per square foot, customer acquisition cost, and retention rates across your entire network. This exercise typically exposes a 20–40% performance gap between your strongest and weakest locations. That gap isn't random. High performers usually operate in markets with stronger product-market fit, better staff, or superior location selection. Low performers often signal fixable operational issues or market conditions that demand strategic attention.
The gap tells you exactly where to focus improvement efforts before scaling further. Businesses that benchmark rigorously reallocate resources immediately, moving staff from 28% labor-cost locations to 35% labor-cost sites, shifting marketing budgets from expensive acquisition markets to efficient ones, and restructuring inventory at high-carrying-cost locations. This reallocation alone typically improves network profitability by 8–15% within six months without opening a single new site.
Rank Locations by Profitability Potential, Not Current Revenue
Resource allocation becomes precise when you rank locations by profitability potential rather than current revenue. A location generating $800,000 annually might rank below a $500,000 site if the smaller location operates with superior unit economics and sits in a market with expansion capacity. Target your highest-potential locations for investment first, whether that means increased marketing spend, premium staff placement, or expanded service offerings. This approach contradicts conventional thinking, which prioritizes current revenue generators over future potential.
Test New Offerings at Your Strongest Performers First
High-potential sites deserve to serve as testing grounds for new services or product lines before rolling them network-wide. Rather than launching a new offering across all locations simultaneously, test new offerings at strongest performers first at two or three high-potential, high-retention sites where customers accept new offerings readily and staff execute flawlessly. A salon testing a new service at its 85% retention location versus its 60% retention location sees vastly different outcomes. The high-retention location provides accurate product-market feedback because execution quality remains consistent. The low-retention location confounds results because operational issues mask the true appeal of the offering.
Test results from strong performers scale predictably. Results from weak locations require skepticism because operational friction may have killed the offering, not market demand. Once testing proves the concept at your best sites, expand to mid-tier locations next, then tackle your most challenging markets last. This staged rollout prevents wasting budget on network-wide launches that should never have left the testing phase. Most businesses skip the testing stage entirely and launch new offerings network-wide, discovering too late that the concept works in some markets but fails in others (when location-specific testing costs less and delivers far more reliable expansion decisions than rolling the dice on a full-network launch).
Final Thoughts
Multi-location analytics transform how you allocate capital and execute growth strategy. The businesses scaling fastest stopped relying on intuition and spreadsheets years ago-they track revenue per square foot, customer retention rates, and labor costs across every location weekly. This real-time visibility reveals which sites deserve investment and which ones need restructuring before they drain more resources.
The competitive advantage belongs to operators who act on location data immediately. While competitors wait for quarterly reports, you reallocate staff to high-potential sites, test new offerings at your strongest performers, and halt expansion plans to underperforming markets before capital gets wasted. This speed compounds: six months of weekly benchmarking typically improves network profitability by 8–15% without opening a single new location.
Implementing multi-location analytics requires consistent metric tracking across all sites, a reporting system that delivers data weekly rather than quarterly, and the discipline to act on what the data reveals. Start tracking these metrics this week with Schedly, which provides multi-location management and an advanced analytics dashboard to monitor performance across all your sites in one place. Real-time insights into your operations accelerate growth decisions and prevent capital from flowing toward the wrong markets.