
Schedly resources
Scheduling Analytics Dashboard: Track Performance In One View
Most businesses have no idea how many bookings they're losing or why customers cancel. Your scheduling data sits there, unused, while you make decisions based on guesses instead of facts.
A scheduling analytics dashboard changes that. At Schedly, we've seen teams cut no-shows by 20% and boost staff utilization by 30% simply by watching the right metrics. This post shows you which numbers matter and how to act on them.
Why Scheduling Analytics Matter for Your Business
Most teams treat scheduling data as a byproduct rather than a business asset. You collect booking information, cancellations, and no-show data every single day, but it sits unused in your system while you make staffing decisions based on intuition. A scheduling analytics dashboard changes that. When you track the right metrics in a single dashboard, you stop guessing and start knowing exactly what happens in your business. According to Forrester's TEI Study on enterprise analytics platforms, companies that implement data-driven dashboards achieve a 299% ROI. That's not theoretical-it's the financial impact of turning raw scheduling data into actionable intelligence.
The real cost of ignoring your booking data
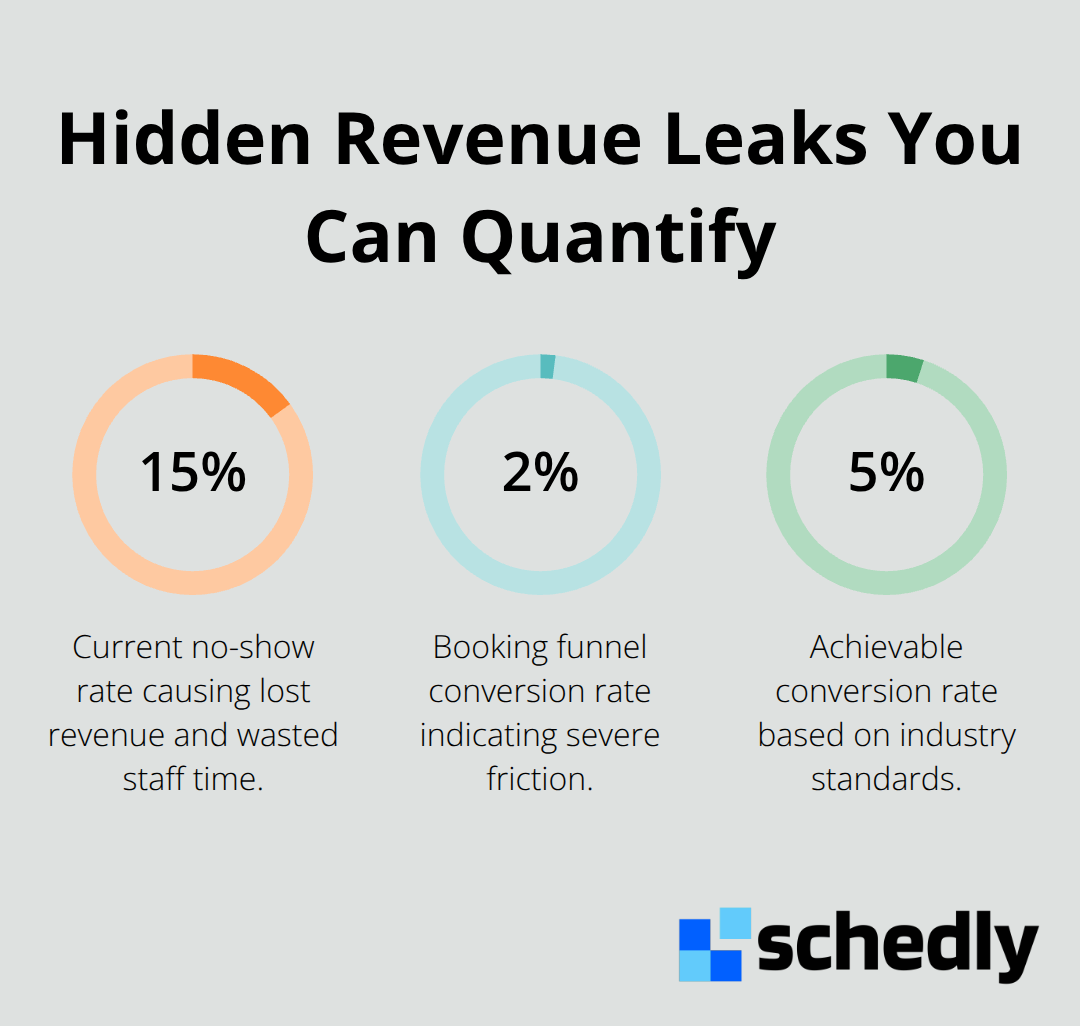
Your scheduling system generates valuable signals about customer behavior and operational efficiency, but without visibility into those signals, you leave money on the table. If your no-show rate sits at 15%, that represents lost revenue and wasted staff time. If your booking funnel has a 2% conversion rate when industry standards show 5% is achievable, you lose half your potential customers. These problems remain invisible without clear data visibility.
How analytics guide smarter operational decisions
The second benefit is operational optimization that actually sticks. When your team sees that Tuesday mornings are consistently 30% understaffed while Wednesday afternoons are overstaffed, you can rebalance schedules to match real demand. You stop scheduling based on tradition or convenience and start scheduling based on customer behavior. This reduces idle time for your employees and eliminates the frustration of overbooking. Staff utilization optimization through strategic scheduling aligns shift schedules with demand, minimizing downtime and enhancing operational efficiency. Analytics also reveal customer preferences that directly shape your service offerings. If data shows 60% of your new customers book within 48 hours of discovering you, you know your online booking experience needs to be frictionless and your confirmation process needs to be solid. If cancellations spike on specific days or times, you can investigate whether a scheduling conflict, pricing issue, or external factor drives the behavior.
What metrics actually matter
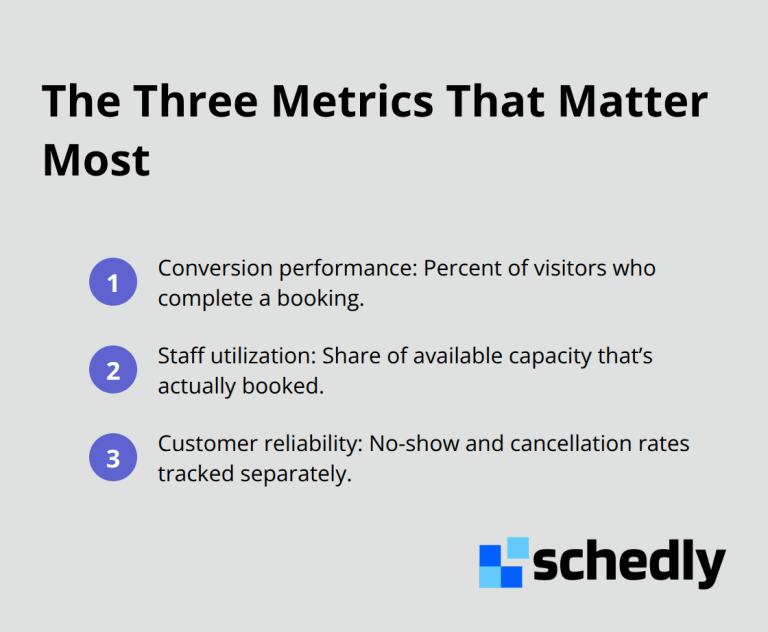
Not all scheduling data deserves equal attention. The metrics that move your business forward fall into three categories: conversion performance (how many people who start the booking process actually complete it), staff utilization (whether your team works at optimal capacity), and customer reliability (no-show and cancellation rates). These three areas directly impact your revenue and operational costs.
Which Metrics Actually Drive Your Revenue
Conversion rate reveals your true booking potential
Conversion rate matters more than raw booking volume, and most teams measure it wrong. You need to track what percentage of people who land on your booking page actually complete a reservation, not just count total bookings. If 1,000 people visit your scheduling page but only 50 book, your conversion rate is 5%. Industry data shows conversion rate for online scheduling typically ranges from 2.8% to 4.2% depending on your industry and how frictionless your booking experience is.
A medical practice with a 3% conversion rate that improves to 5% gains 67% more appointments from the same traffic. That's not a vanity metric-that's direct revenue impact. Track this weekly, not monthly. Weekly data reveals whether your recent changes (removing extra form fields, simplifying payment options, or improving your confirmation email) actually work. If your conversion rate dropped 0.5% last week, investigate immediately. Did you add a new required field? Did payment processing slow down? The faster you spot the problem, the faster you fix lost revenue.
Staff utilization exposes hidden labor costs
Staff utilization is where most scheduling operations leak money. You need to know what percentage of your available staff capacity you actually book. Staff utilization percentage is calculated by dividing total billable hours by total available hours, then multiplying by 100. If you employ five therapists with 40 available hours each per week, that's 200 total capacity hours. If you only book 120 hours, your utilization sits at 60%-which means 80 hours of paid time with no revenue.
Pushing utilization from 60% to 75% without hiring anyone means 30% more appointments from your existing team. Use your dashboard to identify which time slots have the lowest booking rates. Tuesday mornings might run at 40% utilization while Friday afternoons hit 85%. This reveals where demand actually exists and where you schedule staff out of habit rather than customer need. Many teams discover they can reduce hours on slow days and add staff during peak periods, cutting labor costs while improving customer availability.
No-show and cancellation rates demand separate tracking
No-show and cancellation rates directly erode your bottom line, and tracking them separately matters. A 15% no-show rate means one in seven appointments generates zero revenue while you paid staff to be available. A 10% cancellation rate suggests customers booked but then changed their minds-often a sign that your confirmation process is weak or your reminder strategy needs work.
Separate these metrics in your dashboard. If cancellations are high but no-shows are low, your customers are intentionally backing out, which points to pricing, availability windows, or service expectations. If no-shows are high but cancellations are low, customers aren't receiving reminders or their confirmations lack clarity about date and time. The distinction changes how you respond.
These three metrics-conversion rate, staff utilization, and no-show/cancellation patterns-form the foundation of any scheduling dashboard worth your attention. Once you track them consistently, the next step is learning how to act on what the data tells you.
Turn Dashboard Data Into Scheduling Changes
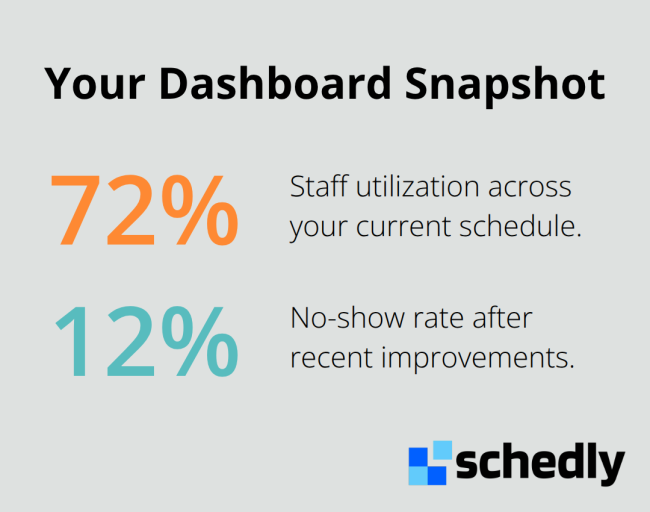
Your dashboard now shows you the metrics that matter. Conversion rate is climbing, staff utilization sits at 72%, and no-shows dropped to 12%. But raw numbers mean nothing without action.
Match staff to actual customer demand
Start with your slowest booking times. If your dashboard reveals that Tuesday mornings convert at 2.1% while Friday afternoons hit 6.8%, that's not random variation-it's a signal about customer demand patterns. Most teams ignore this data and continue staffing equally across all time slots. Instead, cut Tuesday morning staff by 20% and reallocate those hours to Friday afternoons. This single change reduces labor costs on slow days while improving customer availability during peak demand. Track the impact weekly. If your overall conversion rate improves by 0.3% within two weeks, you've found money in your existing schedule without hiring anyone new.
Your dashboard should display which days and times generate the most booking requests, not just completed appointments. This distinction matters because it shows true customer demand independent of your current staffing. If Wednesday at 2pm generates 40 booking requests but you only have one staff member available, you're artificially suppressing your capacity. Adding one more person during that window could book 15 additional appointments weekly. Conversely, if Monday at 10am generates only six booking requests across an entire month, keeping two staff members there is wasteful. Real scheduling helps managers build schedules faster by using rules, availability, labor targets, and staffing guidelines to match staff to actual customer demand, not tradition.
Pull your booking request data from the past eight weeks, group it by day and time, and identify your top 10 and bottom 10 time slots. Reallocate staff from bottom slots to top slots. This creates visible improvements in both customer satisfaction and labor efficiency within 30 days.
Investigate cancellation spikes to fix operational friction
When your dashboard shows that cancellation spikes on specific days, the cause is rarely random. A dental practice discovered that Wednesday cancellations hit 18% while other days stayed at 8%. Investigation revealed that confirmation reminders went out Tuesday evening, but patients had already made conflicting plans. Shifting reminders to 24 hours before the appointment dropped Wednesday cancellations to 9%. Another salon found that cancellations jumped sharply after 4pm bookings, revealing that customers who booked late in the day were more likely to cancel. They introduced a small incentive for early-day bookings and saw cancellations on those slots drop from 12% to 7% within three weeks.
Your dashboard can flag these patterns, but you must investigate the root cause. High cancellations on a specific day might indicate scheduling conflicts, poor communication, pricing issues, or simply that staff confirmation calls aren't happening. Review your actual confirmation process alongside your cancellation data. If you're relying on automated reminders alone, add a personal call 24 hours before the appointment. Reminders sent 48 hours before an appointment play a crucial role in effective appointment reminders, helping reduce no-shows by reclaiming significant revenue.
Final Thoughts
Your scheduling analytics dashboard now shows you exactly where your business stands. You know your conversion rates, staff utilization, and cancellation patterns. You've identified which time slots drive revenue and which ones drain resources. Data without action is just noise, but the teams that actually grow watch their metrics weekly and adjust their operations based on what they see.
Start small this week. Pick one insight from your dashboard and act on it immediately. If your Friday afternoons show 85% utilization while Tuesday mornings sit at 40%, reallocate staff to match actual demand. If cancellations spike on Wednesday, investigate your confirmation process and adjust your reminder timing. These small changes compound into significant improvements over time.
We at Schedly built our platform with this exact workflow in mind. Schedly's scheduling analytics dashboard gives you real-time visibility into your booking rates, staff utilization, and customer behavior across your entire operation, then helps you act on those insights immediately. The businesses that win are the ones that know their numbers and adjust faster than their competition.