
Schedly resources
Small Business Analytics: From Data To Decisions
Most small business owners make decisions based on gut feeling rather than data. At Schedly, we've seen firsthand how small business analytics changes this-turning scattered information into clear, actionable insights.
The difference between guessing and knowing is measurable. When you track the right metrics and act on them, your business performs better.
Why Small Businesses Need Analytics
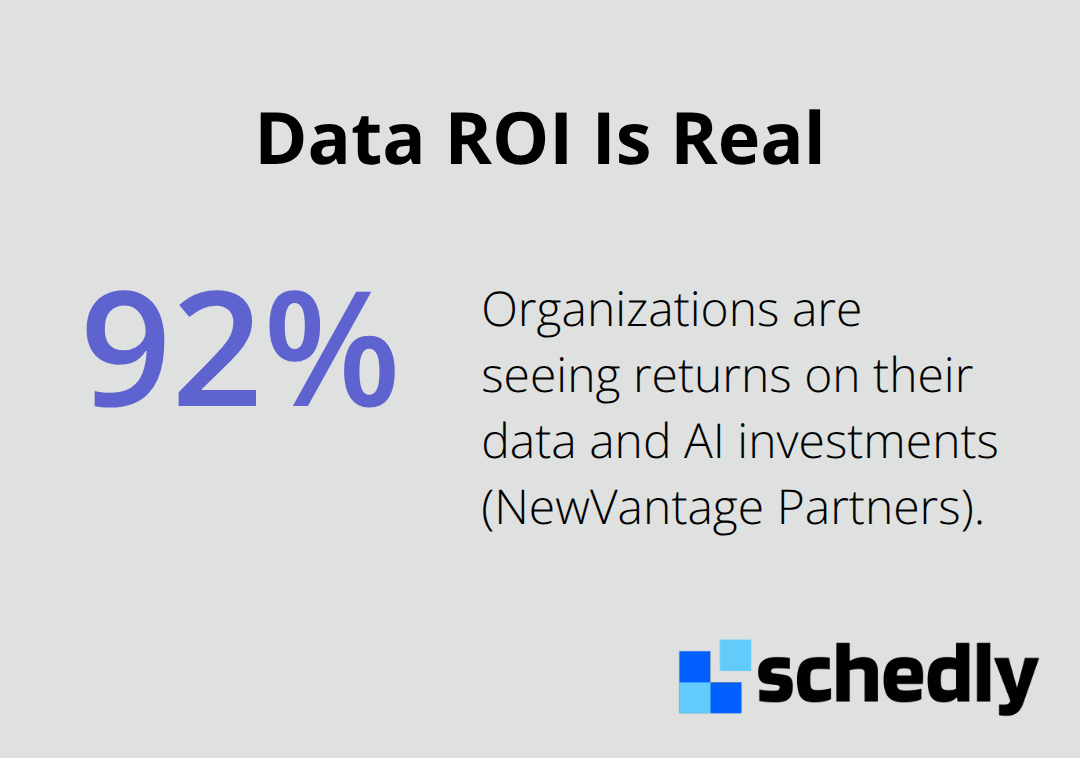
Small business owners waste enormous amounts of time on decisions that could be made instantly with the right data. According to NewVantage Partners, 92% of organizations are seeing returns on their data and AI investments, yet most small businesses haven't captured even a fraction of that potential. The problem isn't complexity-it's that small business leaders operate without visibility into what's actually happening in their business. You might think your best customers are one demographic when your actual data shows something entirely different. You might assume a marketing channel is underperforming when it's actually your highest-converting source. Without analytics, you run your business with your eyes closed.
See What's Actually Happening
The first reason small businesses need analytics is visibility. When you track revenue, customer acquisition costs, and operational expenses, you stop guessing about profitability. Predictive analytics helps forecast demand and optimize inventory, which directly reduces stockouts and excess inventory costs. A retail business tracks purchase histories and online browsing patterns to identify which products drive the most margin, not just the most volume. Healthcare providers monitor patient statistics to intervene early, preventing costly emergencies. The moment you measure something, you understand it. Most small businesses track sales in spreadsheets but never connect that data to marketing spend, operational costs, or customer satisfaction. This fragmentation creates blind spots. When your data lives in disconnected systems-your accounting software separate from your CRM, separate from your point-of-sale system-you miss the complete picture.
Understand Your Customers Before They Leave
Customer behavior analytics reveal patterns that feel invisible until you measure them. You identify which customer segments have the highest customer lifetime value, which ones are about to churn, and what triggers repeat purchases. A small business analyzes customer data to segment audiences and map their buying journey, then tailors marketing messages to increase conversions. This isn't theoretical-it's the difference between sending generic promotions to everyone and sending targeted offers to the customers most likely to respond. Real-time data analytics give you a live pulse on operations, enabling immediate decisions when trends shift. If you notice customer complaints spiking around a specific product or service, you catch it before it damages your reputation. If you see seasonal demand patterns, you adjust staffing and inventory ahead of time instead of reacting in crisis mode.
Connect Your Data to Real Business Outcomes
Most small businesses collect data without connecting it to what actually matters-revenue, profit margins, and customer lifetime value. When you link your analytics to these outcomes, decisions become obvious. A business that tracks which marketing channels produce customers with the highest retention rates stops wasting money on channels that bring in one-time buyers. A service business that monitors operational efficiency (how long tasks take, where bottlenecks occur) reduces costs and improves delivery speed. The businesses that outperform their competitors aren't the ones with the most data-they're the ones that act on it. Your next step involves choosing which metrics matter most to your business and selecting tools that make those metrics visible.
Which Metrics Actually Matter to Your Bottom Line
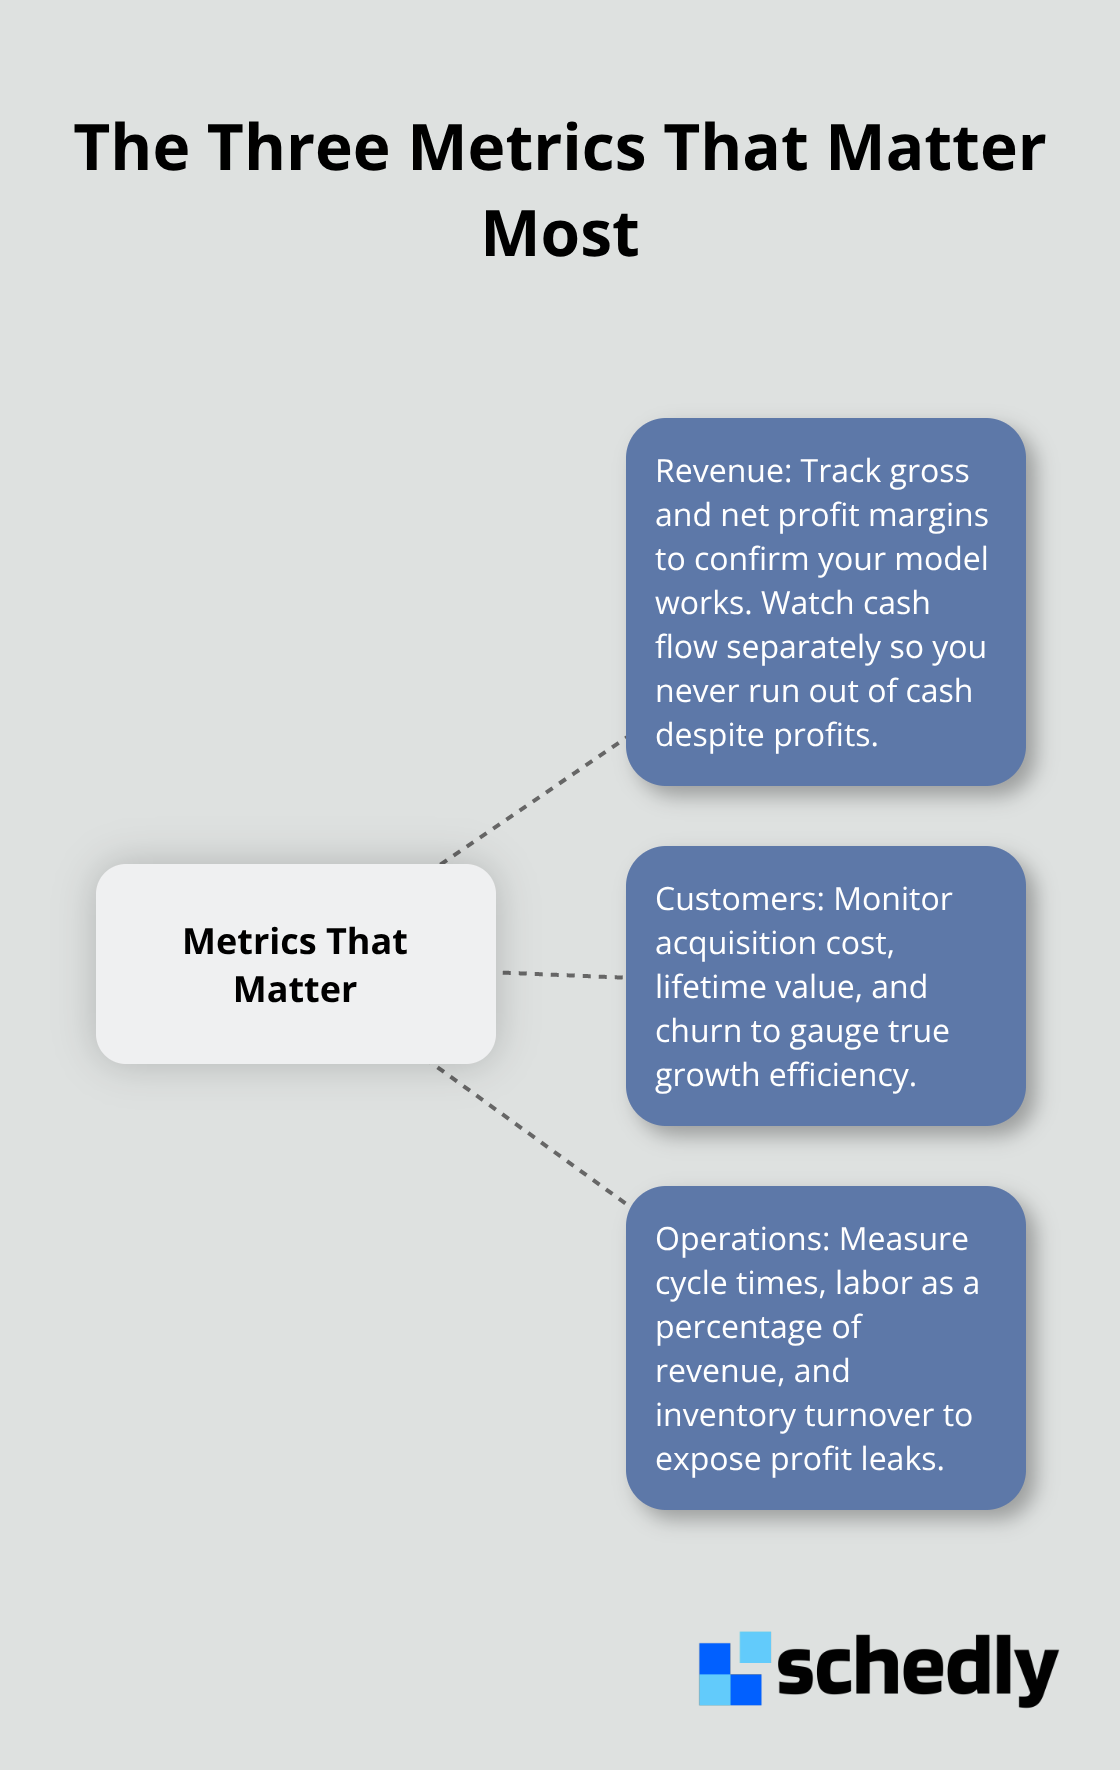
The mistake most small business owners make is tracking too many metrics without understanding which ones move the needle. You end up drowning in dashboards while missing what actually drives profit. Start with three categories that directly connect to revenue and survival: how much money comes in and stays in, who your customers are and whether they stick around, and whether your operations run efficiently.
Revenue Metrics Show If Your Business Model Works
Revenue metrics tell you if your business model works. Track gross profit margin, not just total revenue, because a business that sells more while cutting into margins heads toward collapse. Monitor your actual profit margin by dividing net profit by total revenue. A retail business might discover that while sales grew 20% year-over-year, profit margins fell from 35% to 28% because operational costs climbed faster than revenue. This reveals a dangerous trend that raw sales numbers hide.
Track cash flow separately from profit because a profitable business can still run out of cash. If customers take 90 days to pay while suppliers demand payment in 30 days, you'll face real cash problems despite strong profitability. Most accounting software now shows cash flow dashboards automatically, so use that data instead of guessing about your financial health.
Customer Metrics Expose Your Real Growth Rate
Customer metrics matter because acquiring a new customer costs five to seven times more than retaining an existing one, yet most small businesses focus entirely on acquisition. Calculate your customer acquisition cost by dividing total marketing spend by new customers gained in a period. If you spent $5,000 on marketing last month and gained 20 customers, your CAC is $250. Now compare that to customer lifetime value. If those customers spend an average of $1,200 over their relationship with you, your LTV is $1,200. A healthy ratio is LTV to CAC of at least 3:1, meaning you earn $3 for every $1 spent acquiring that customer.
Measure churn rate by tracking what percentage of customers stop doing business with you each month. A service business with 100 customers that loses 5 each month has a 5% monthly churn rate, which annualizes to roughly 50% annual churn. That's catastrophic and means you're constantly replacing customers instead of growing.
Operational Efficiency Reveals Silent Profit Leaks
Operational efficiency reveals where money leaks out silently. Measure how long it takes to complete core processes, from when a customer orders to when they receive their product, or from appointment booking to service delivery. Track labor costs as a percentage of revenue. If your industry standard is 30% and you're at 45%, you have a staffing or productivity problem that eats profit.
Monitor inventory turnover by dividing cost of goods sold by average inventory value. Slow-moving inventory ties up cash and wastes storage space. These three metric categories connect directly to whether your business survives and grows. Once you identify which metrics matter most, you need systems that surface these numbers automatically-without requiring manual spreadsheet updates every week.
How to Build Your Analytics Stack Without Breaking the Budget
The biggest mistake small businesses make is choosing analytics tools before understanding what they actually need to measure. You end up paying for features you never use while missing critical data that should be visible. Start differently: identify your three to five most important metrics from the previous section, then choose tools that surface only those metrics clearly. Most small businesses don't need enterprise software costing thousands monthly.
Audit the Data You Already Possess
Most small businesses waste months collecting new data when they already possess the information needed to make better decisions. Your point-of-sale system contains transaction history. Your accounting software shows expense patterns. Your email platform reveals customer engagement. Your CRM holds interaction records. Before purchasing anything new, audit what data you already generate daily and where it lives. Create a simple spreadsheet listing your data sources: sales system, accounting software, email platform, customer service tool, website. Next to each, note what metrics that system already tracks. You'll likely discover you can answer 70 percent of your important questions with data you already possess but aren't currently using.
Connect Your Disconnected Systems
The second step involves connecting these disconnected systems so data flows automatically instead of requiring manual spreadsheet updates. Most modern software offers API integrations or built-in connectors. Your accounting software can push monthly profit and loss data to your analytics tool automatically. Your CRM can sync customer acquisition costs without manual entry. This automation prevents the human errors that plague spreadsheet-based analytics and frees your team from tedious data entry. Start with integrating your top three data sources, not all of them. Get those working reliably before expanding to additional systems.
Train Your Team to Interpret Data
The final barrier isn't technology-it's people who don't know how to interpret what the data shows. A dashboard full of charts means nothing if your team can't spot trends or understand what they mean for decisions. This requires training that focuses on practical application, not statistical theory. Your team needs to understand what your three key metric categories mean and how changes in those metrics connect to business outcomes. If your customer acquisition cost rises month-over-month, your team should immediately recognize this as a problem requiring investigation. If your operational efficiency metric drops, they should know where to look for the cause.
Most small business owners learn this through hands-on practice, not through formal training. Start by assigning one person responsibility for reviewing key metrics weekly and presenting findings to leadership. This person doesn't need to be a data scientist-they need curiosity and the ability to ask why. After three months of weekly reviews, patterns become obvious. Your team develops intuition about what normal looks like versus what signals problems. If your budget allows, investing in a short data literacy course helps teams move faster, but hands-on practice with your actual business data teaches more than any generic course.
Final Thoughts
Small business analytics transforms how you operate by shifting decisions from intuition to evidence. The companies outperforming their competitors aren't necessarily larger or better funded-they're the ones acting on data instead of assumptions. You don't need enterprise software or a dedicated data team to start; you need clarity on three to five metrics that directly impact revenue and survival, then systems that surface those metrics automatically.
Your first step involves auditing what you already measure across your accounting software, CRM, point-of-sale system, and email platform. Connect these systems so information flows automatically rather than requiring manual spreadsheet updates, then assign one person responsibility for reviewing key metrics weekly and presenting findings to leadership. This person learns your business through practice, and as your analytics capability grows, you scale gradually by adding new metrics only when you've mastered the existing ones.
Tools like Schedly help small business analytics by surfacing key metrics automatically so your team spends less time hunting for information and more time acting on it. The businesses that win start measuring, learn what the numbers mean, and adjust their decisions accordingly.