
Schedly resources
SMB Analytics Best Practices for Smarter Growth

Most small and medium businesses are making decisions based on gut feeling rather than data. This costs them money, missed opportunities, and customers they don't understand.
At Schedly, we've seen firsthand how SMBs that adopt analytics best practices grow faster and smarter than their competitors. The good news is you don't need expensive enterprise software or a data science team to get started.
Why Analytics Changes Everything for Small Businesses
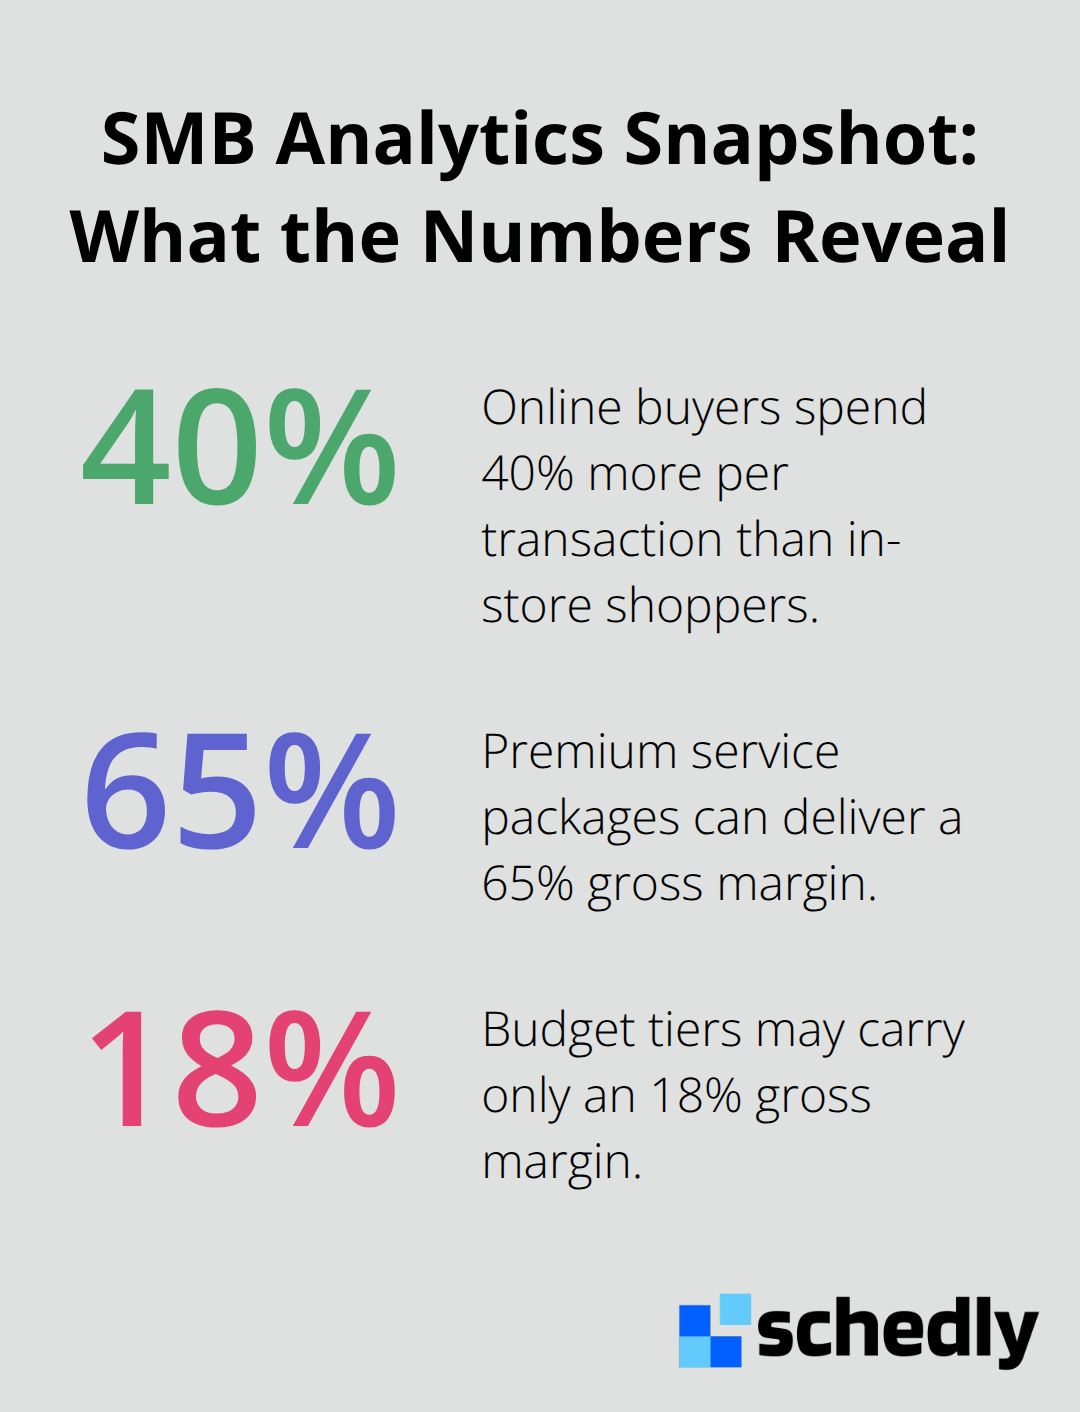
Guesswork costs money. A cafe owner might assume afternoon shifts need three staff members, but data reveals that traffic peaks at 4 PM with only two people needed-wasting payroll for six months straight. A boutique owner assumes their online shoppers match in-store visitors until analytics shows online buyers spend 40% more per transaction, suggesting the entire marketing budget should shift. These aren't theoretical scenarios. Real SMBs lose thousands annually because they operate blind, making decisions based on what feels right rather than what the numbers reveal.
The Cost of Operating Without Data
Most SMBs operate with spreadsheets scattered across emails and devices, creating a fragmented picture that guarantees missed opportunities. One team reports revenue one way, finance reports it differently, and nobody knows which number is correct. This isn't just frustrating; it directly impacts decisions about hiring, inventory, and marketing spend. A boutique owner might cut a product line thinking it underperforms, only to later discover the data was incomplete-missing online sales or wholesale orders. A service business might overstaff for months because they eyeball demand instead of tracking booking patterns week by week. Analytics reveals what's actually happening: which customers generate the most profit, which services or products drain resources, which marketing channels deliver real revenue versus vanity metrics like clicks or impressions. The global data analytics market is projected to grow from USD 64.75 billion in 2025 to USD 785.62 billion by 2035, reflecting how essential analytics has become for competitive survival.
Speed Beats Perfection in Data-Driven Decisions
The SMBs pulling ahead aren't waiting weeks to analyze data. They check dashboards weekly, spot trends early, and adjust quickly. If email campaigns show declining open rates, they test new subject lines within days instead of months. If a particular product line shows sudden demand spikes, they restock or promote it immediately. This speed compounds. A business that acts on retention signals-identifying which customers are at risk of leaving-can intervene with a targeted offer before they're gone. One that tracks cash conversion cycles knows exactly how much working capital they need and can negotiate better payment terms with suppliers. Conversation data often matters as much as dashboard numbers. Customer support tickets, phone calls, and intake conversations reveal why prospects pause, why customers cancel, and which features spark genuine interest. Many SMBs overlook this qualitative signal, treating customer conversations as separate from analytics rather than as a primary data source that predicts behavior better than abstract metrics. The path to scalable growth isn't accumulating more analytics software; it's identifying the signals that actually change customer behavior and acting on them fast.
What Comes Next
The real question isn't whether you need analytics-it's which metrics actually move your business forward. Not every number matters equally, and chasing vanity metrics wastes time and resources. The next section breaks down the specific metrics that SMBs should track to make smarter decisions about revenue, customers, and growth.
Which Metrics Actually Drive Profit
Most SMBs track the wrong numbers. They monitor website traffic, social media followers, or email subscribers-vanity metrics that feel good but don't directly impact revenue. The metrics that matter connect directly to money flowing in and out of your business.
Revenue and Profitability Metrics That Count
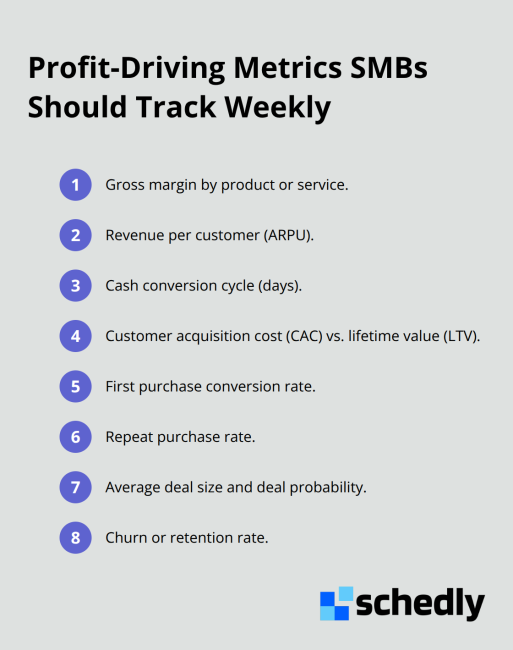
Gross margin by product or service reveals which offerings actually generate profit after direct costs. A service business might discover that premium packages have a 65% margin while budget tiers sit at 18%, shifting how they price and market. Revenue per customer tells you whether your business model scales or if you're stuck chasing volume. Cash conversion cycle measures how long cash sits tied up between paying suppliers and collecting from customers-a 45-day cycle versus a 15-day cycle means the difference between needing external financing and having working capital to invest in growth.
Customer Economics Shape Your Strategy
Customer acquisition cost paired with lifetime value determines whether your marketing spend makes sense. If you spend $500 acquiring a customer who generates $1,200 over their lifetime, that's healthy. If acquisition costs $800 and lifetime value is $900, you're barely profitable and vulnerable to market shifts. Conversion rate matters, but only when tied to specific decision points that predict behavior. The first purchase conversion rate matters more than traffic-to-visit conversion because it shows how many visitors actually become customers. Repeat purchase rate matters more than raw transaction volume because retention signals sustainable growth far better than one-time sales.
Pipeline Health Requires Precision
Sales pipeline health requires tracking deal probability and average deal size. A pipeline with 50 small deals has different risk than 5 large deals, and knowing this shapes hiring and cash flow planning. Most SMBs treat these metrics as separate. Revenue metrics live in one spreadsheet, customer data in another, and operational numbers nowhere tracked at all. A unified dashboard connecting your payment processor, CRM, and accounting software reveals patterns invisible in isolation.
Connect Your Data Sources for Real Insights
For example, you might discover that customers acquired through referrals have 40% higher lifetime value than paid advertising customers, completely shifting your marketing strategy. Or that customers who interact with support within their first week have 3x higher retention rates, justifying investment in proactive onboarding. Tools like Power BI or Google Looker Studio let you build these dashboards without expensive consultants. Try starting with three to five metrics tied directly to revenue and profitability, review them weekly, and act on what changes. This beats analyzing dozens of metrics monthly and doing nothing.
Weekly reviews create faster feedback loops. Monthly reviews delay action on retention signals or cash flow problems until damage is done. The discipline is simple: pick metrics that predict behavior, connect your data sources, and check weekly. Everything else is noise. The next step is choosing the right tools to automate this process without draining your budget.
How to Start Analytics on Any Budget
You don't need enterprise software or a dedicated data analyst to implement analytics. Most SMBs already have the tools they need sitting unused in their existing systems. Google Analytics 4 is free and tracks customer behavior across your website and devices, offering event-based insights without paying a dollar. If you use Shopify, your built-in analytics dashboard shows sales, traffic sources, and product performance. If you manage a service business, your booking system likely captures scheduling patterns that reveal demand trends. The real cost isn't software; it's connecting these scattered data sources into one place so you actually see patterns.
Free and Low-Cost Tools That Work
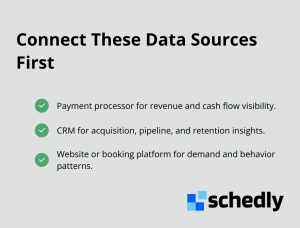
Power BI's free desktop version lets you build dashboards by pulling data from Excel, Google Sheets, or SQL databases without monthly subscriptions. Google Looker Studio remains completely free and connects directly to Google Analytics, your CRM, and spreadsheets through drag-and-drop simplicity. Metabase is open-source and costs nothing to self-host, offering SQL query capabilities for teams comfortable with databases. The global data analytics market growing from USD 64.75 billion in 2025 to USD 785.62 billion by 2035 reflects how essential this became, but that growth benefits SMBs most when they avoid overpaying for features they'll never use. Start by identifying which three data sources matter most: your payment processor, your CRM, and your website or booking platform. Connect those first. Everything else can wait.
Automation Transforms Data Into Action
Manual reporting takes 10 to 15 hours monthly for most SMBs, consuming time that could go toward strategy or customer relationships. When you automate data collection and refresh, your dashboard updates while you sleep, and trends become visible immediately rather than weeks later. Power BI and Looker Studio both offer automatic data refresh on schedules you set, meaning your metrics stay current without human intervention. For agencies or service businesses handling multiple clients, Whatagraph generates polished, multi-channel reports automatically and formats them client-ready, eliminating the template-building work entirely. Databox consolidates data from over 100 sources into a single unified dashboard with automated alerts, so your team gets notified when metrics hit thresholds instead of discovering problems in monthly reviews.
Weekly Reviews Drive Faster Decisions
The discipline of checking dashboards weekly only works if the data is already there waiting. Once automation is live, shift your team's focus from data gathering to decision-making. Assign one person weekly reviews of three to five key metrics and flagging what changed. This person doesn't need to be technical; they need to ask why numbers moved and what action makes sense. Weekly reviews create faster feedback loops. Monthly reviews delay action on retention signals or cash flow problems until damage is done. The difference between a business that grows 10% annually and one that grows 40% often comes down to whether someone actually looks at the data and acts on it fast.
Building a Culture That Acts on Data
Many SMBs fail not because they lack tools but because they build dashboards and then ignore them, treating analytics as a checkbox rather than a decision engine. Your team needs to understand that data exists to answer questions and guide choices, not to create busywork. Start with one metric that directly impacts revenue (like cash conversion cycle or customer lifetime value) and make it visible to everyone. When the team sees how a small change in onboarding reduces churn by 5%, they start believing in data-driven decisions. This habit matters more than perfect data. A business that acts on imperfect weekly insights outpaces one that waits for flawless monthly reports.
Final Thoughts
Analytics transforms how SMBs compete. The businesses pulling ahead connect their data sources, check metrics weekly, and act fast on what they find-no expensive software or data teams required. Your existing systems already capture everything you need: Google Analytics tracks website behavior for free, your booking platform reveals demand patterns, and your CRM holds customer interaction history. The missing piece is connecting these sources and reviewing them regularly.
Speed compounds in ways that spreadsheets never will. A business that spots a cash flow problem two weeks earlier negotiates better payment terms or adjusts hiring plans before damage occurs. One that identifies a product line gaining traction capitalizes on momentum instead of discovering it months later in annual reviews. SMB analytics best practices all share this common thread: weekly reviews create faster feedback loops than monthly ones, and faster feedback loops drive sustainable growth. The discipline matters more than perfection-a team that acts on imperfect weekly insights outpaces one that waits for flawless monthly reports.
If you manage appointments, bookings, or client scheduling, Schedly's analytics dashboard helps you track key metrics and make data-driven decisions without building dashboards from scratch. Pick one high-impact metric this week, connect your data sources, and schedule a weekly review to act on what you find.